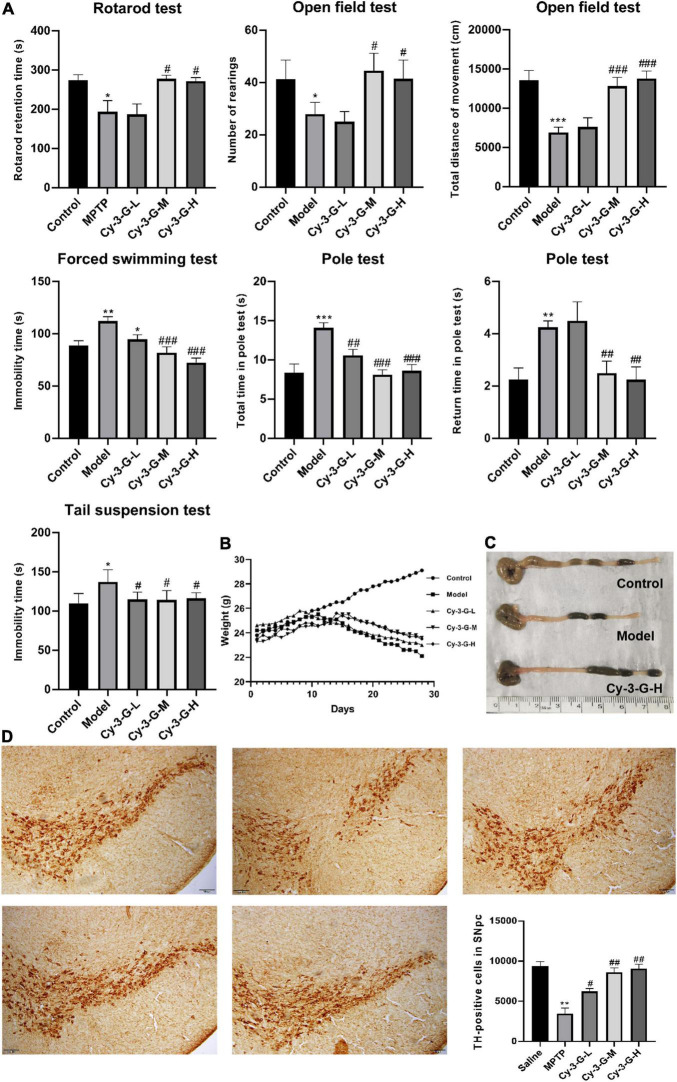
FIGURE 2.
Effects of Cy-3-G on the behavioral test (A), body weight (B), and colon length (C) of PD model mice; Representative microphotographs of dopaminergic neurons stained for TH and the quantification of TH positive cells in each group (D). The pictures were taken at an original magnification of 10×. Control: blank group; Model: MPTP -intoxicated group; Cy-3-G-H: high dosage group; Cy-3-G-M: medium dosage group; Cy-3-G-L: low dosage group; *p < 0.05, **p < 0.01, ***p < 0.001 vs. Control; #p < 0.05, ##p < 0.01, ###p < 0.001 vs. Model.

