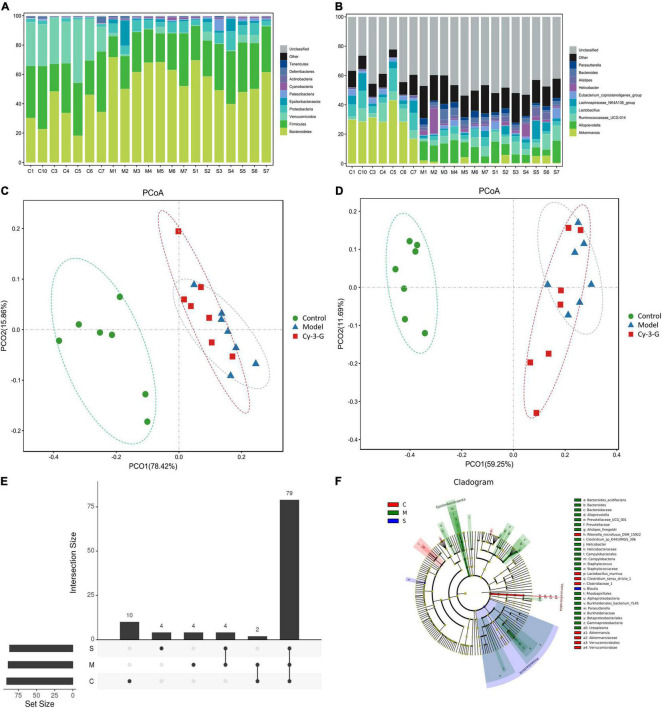
FIGURE 6.
The histogram of species distribution at the phylum (A) and genus (B) levels in three groups revealed by 16S rRNA sequencing (different colors represent different bacteria at phylum or genus levels). PCoA analysis among control, model, and Cy-3-G groups at the phylum (C) and genus (D) levels. Upset plot based on the gut microbiota among control, model, and Cy-3-G groups (E); Cladogram of microbial taxa differentially represented among control, model, and Cy-3-G group (F).

