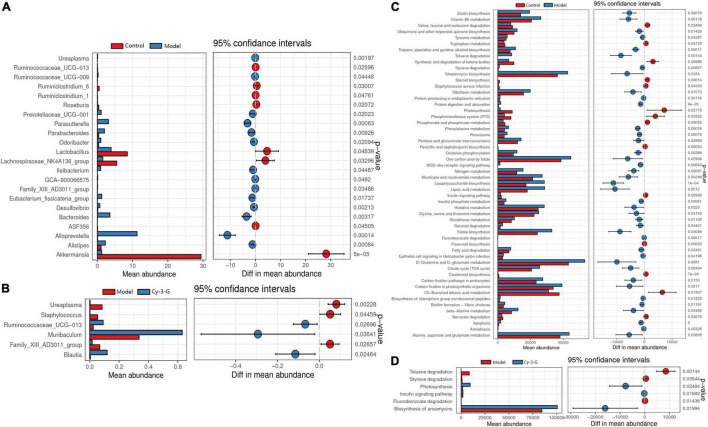
FIGURE 7.
The differential abundance taxa in phyla (A) and genera (C) based on the Welch’s t-test analysis between control vs. model (A) and model vs. MPTP-induced (C) groups; The function of the gut microbiota of mice in the control and MPTP-induced groups based on Tax4Fun between control vs. model (B) and model vs. MPTP—induced (D) groups.

