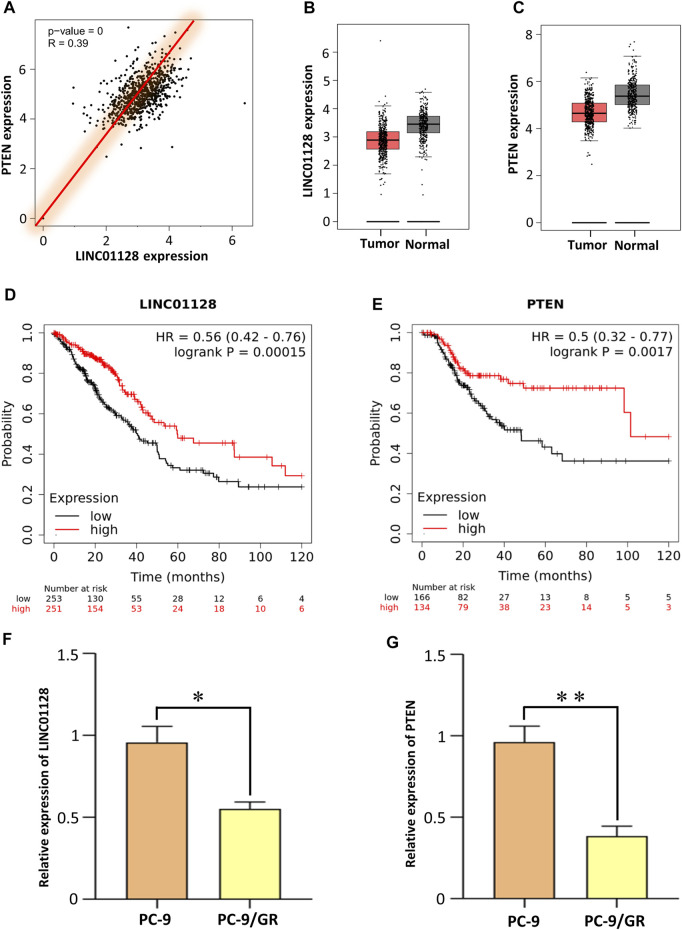
FIGURE 6.
Analysis of the gene expression and qRT-PCR validation for LINC01128 and PTEN. (A) Correlation between LINC01128 and PTEN. (B,C) Gene expression levels of LINC01128 and PTEN in tumor and normal tissues, respectively. (D,E) Kaplan–Meier survival curve of LINC01128 and PTEN. (F,G) Expression level of LINC01128 and PTEN was assessed by the qRT-PCR analysis (*p < 0.05 and **p < 0.01).

