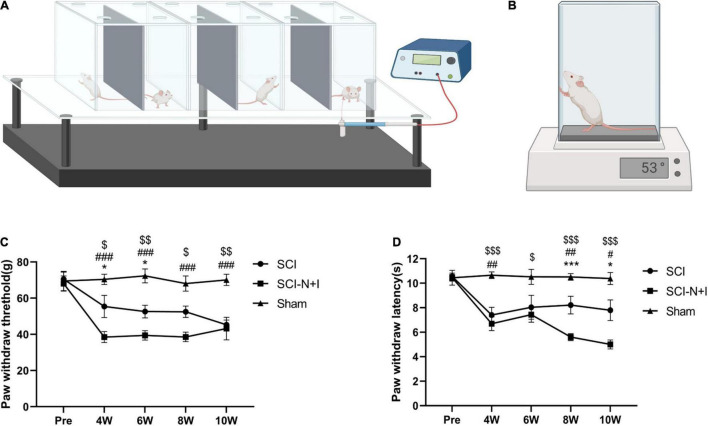
FIGURE 3.
Schematic diagram of neuropathic pain measurements. (A) Electronic von Frey evaluation model diagram. Each rat was placed in a transparent cage. Then, we gradually stimulated the soles of the feet through barbed wire at the bottom of the cage. The threshold of foot withdrawal was recorded as an evaluation value. Double measurements were recorded three times and the average value was taken each time. The evaluation interval was 10 min (n = 7–10 for the SCI-N + I group and the SCI group, n = 6 for the Sham group). Each rat was evaluated three times, and the average value was determined. (B) Diagram showing how we performed hot plate assessments on rats using a hot plate preheated to 53 ± 0.1°C. Reaction times (e.g., for jumping) were recorded three times for each rat and the average value was taken at a time interval of 10 min each time (6–8 animals per group were evaluated at each time point; each rat was evaluated three times and the average value was taken). (C) The results of von Frey evaluation at baseline and 4–10 weeks after surgery. (D) The results of the hot plate evaluation before and 4–10 weeks after surgery. *,#,$ represents the significance of the differences between the SCI vs. SCI-N + I, Sham vs. SCI-N + I, and SCI vs. Sham groups at each time point (one-way ANOVA, Bonferroni’s post hoc test). One, two, and three symbols indicate P < 0.05, P < 0.01, and P < 0.001, respectively.

