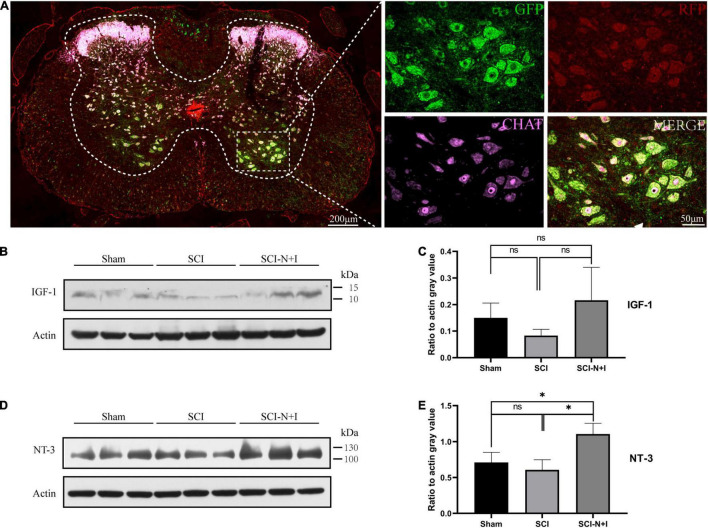
FIGURE 4.
The detection of AAV expression. (A) Four weeks after surgery, the spinal cord of the AAV injection group (n = 3) was randomly selected for immunofluorescence staining to judge whether AAV had been successfully transfected. (B,C) At the end of the experiment, the level of IGF-1 protein in the lumbar distension of the spinal cord was detected by western blotting (n = 3 per group). (D,E) The level of NT-3 protein in the lumbar distension of the spinal cord was detected by western blotting at the endpoint of the experiment (n = 3 per group). *Represents the significance of the difference between groups (one-way ANOVA, Bonferroni’s post hoc test). One, two, and three symbols indicate P < 0.05, P < 0.01, and P < 0.001, respectively. ns indicates no statistical difference between groups.

