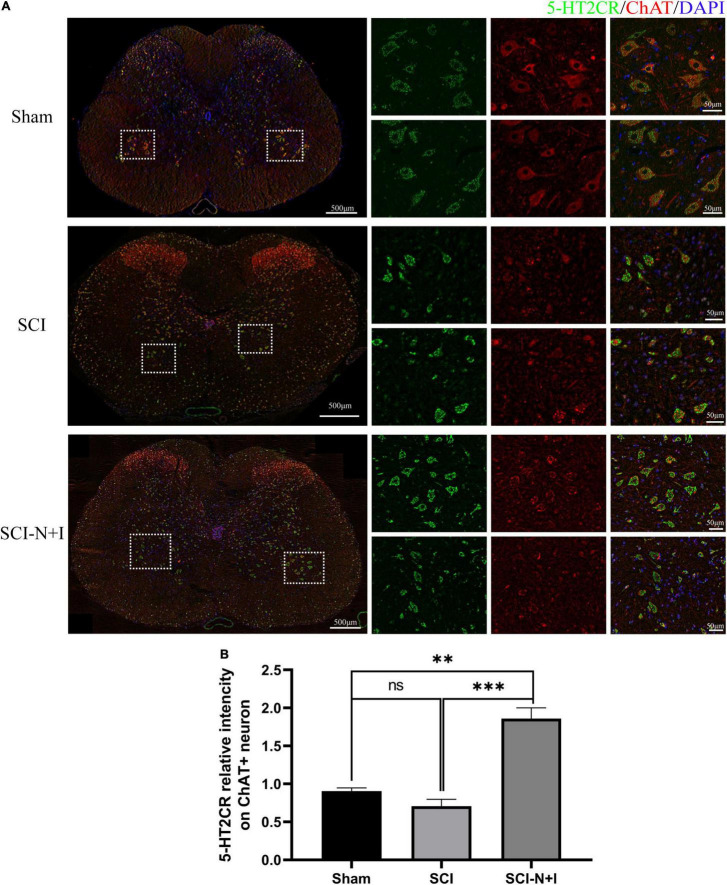
FIGURE 9.
The expression of 5-HT2CR in spinal motoneurons. (A) Immunofluorescence staining of 5H-2CR and ChAT in the spinal cords of rats from different groups. (B) Co-localization density of 5-HT2CR and motoneurons, n = 6 in the SCI and SCI-N + I groups, respectively, n = 3 in the sham group (108 ChAT-positive neurons in six visual fields in the sham group, 803 ChAT-positive neurons in 13 visual fields in the SCI group, 787 ChAT-positive neurons in 18 visual fields in the SCI-N + I group). *Represents the significance of the difference between groups (one-way ANOVA, Bonferroni’s post hoc test). One, two, and three symbols indicate P < 0.05, P < 0.01, and P < 0.001, respectively.

