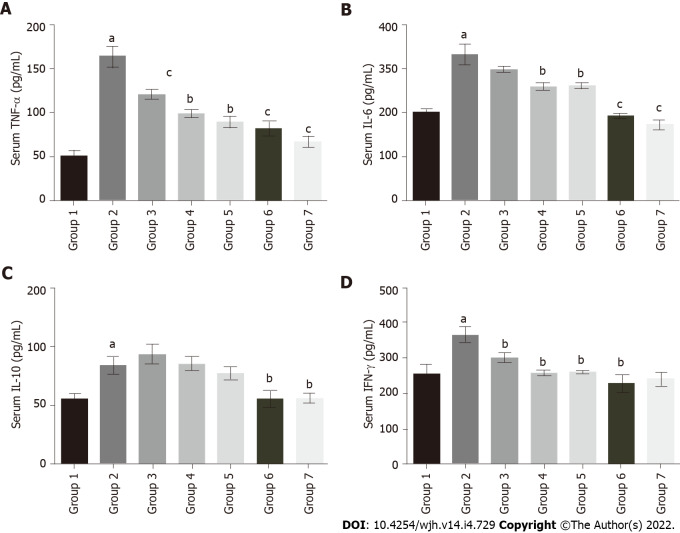
Figure 5.
Effect of baicalin on serum inflammatory markers in fluoxetine treated rats. A: Tumor necrosis factor-α; B: Interleukin (IL)-6; C: IL-10; D: Interferon-γ. The values are expressed in pg/mL. Group 1: Control rats; group 2: Fluoxetine treated rats (10 mg/kg); group 3: Fluoxetine (10 mg/kg) + baicalin (50 mg/kg); group 4: Fluoxetine (10 mg/kg) + baicalin (100 mg/kg); group 5: Fluoxetine (10 mg/kg) + silymarin (100 mg/kg); group 6: Baicalin (100 mg/kg); group 7: Silymarin (100 mg/kg). Data represent mean ± SD, n = 6. aRepresents a significant difference compared with group 1, P < 0.05; brepresents a significant difference compared with group 2, P < 0.05; crepresents a significant difference compared with group 2, P < 0.005; drepresents a significant difference compared with group 2, P < 0.0001. TNF: Tumor necrosis factor; IL: Interleukin; IFN: Interferon.

