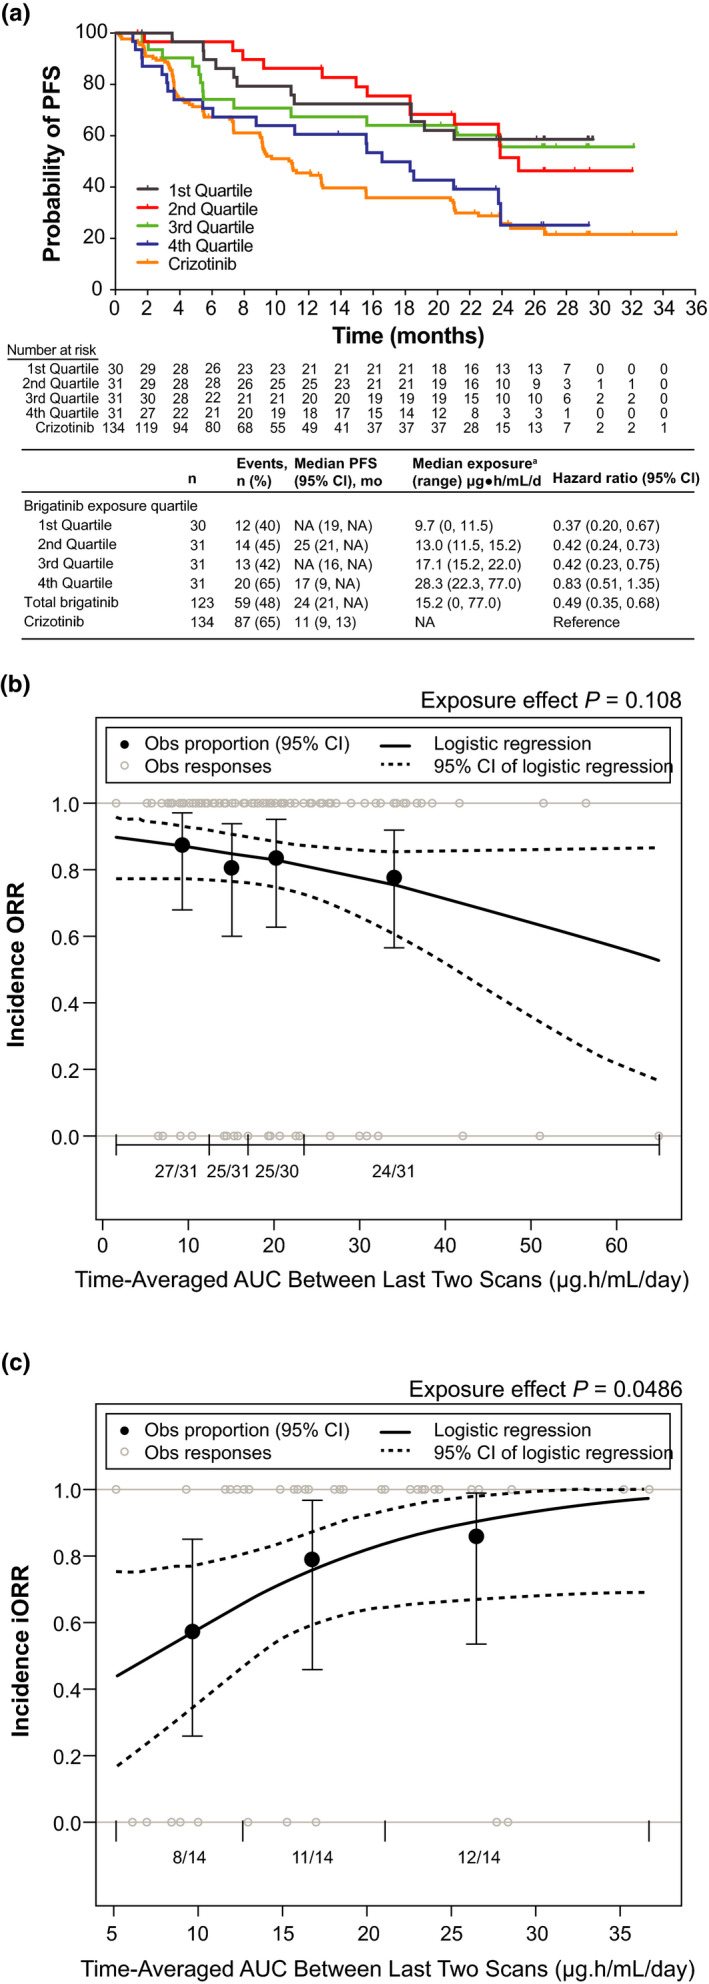
FIGURE 2.

Exposure‐efficacy analyses. (a) Kaplan‐Meier probability of PFS by simulated brigatinib exposure quartiles. To evaluate the relationship between brigatinib exposure and PFS, a static exposure metric of time‐averaged AUC between the last two disease assessment scans preceding progression or censoring was used. PFS KM estimates plotted by exposure quartiles suggested that patients with higher exposure had faster onset and higher incidence of disease progression than those with lower exposure. Values for the crizotinib arm of the study are superimposed; however, no exposure values were available for crizotinib. For median PFS values, NA indicates that the probability of having no disease progression or death has not yet gone beyond 0.50 and hence the median survival time cannot be determined. aSimulated exposure metric is time‐averaged AUC between the last two disease assessment scans preceding progression for PFS or censoring. Observed incidence and model‐predicted probability of (b) ORR and (c) iORR as a function of brigatinib exposure. The relationships between ORR and iORR and brigatinib exposure were analyzed using the static exposure metric of time‐averaged AUC between the last two disease assessment scans preceding best confirmed response. The probability of response was plotted against predicted exposure values, and probabilities were calculated by observed exposure quartiles or tertiles. Exposure–clinical response relationships were characterized by logistic regression models, which did not show a significant relationship between the probability of achieving ORR and time‐averaged brigatinib AUC between the last two disease assessment scans preceding the best confirmed objective response. In contrast, time‐averaged brigatinib AUC between the last two disease assessment scans preceding best confirmed intracranial response was a statistically significant predictor of iORR in patients with brain metastases at baseline. Dotted curves represent the 95% CI of the logistic regression model prediction. The horizontal black line separated by vertical black solid lines denotes the brigatinib exposure range in each quartile (ORR) and tertile (iORR). Black dots (vertical lines) represent the observed proportion of patients (95% CI) in each quartile (ORR) and tertile (iORR). n/N is the number of patients with events/total number of patients in each quartile (ORR) and tertile (iORR). Grey open circles represent observed individual data. AUC, area under the concentration‐time curve; CI, confidence interval; KM, Kaplan‐Meier; iORR, intracranial objective response rate; NA, not available; Obs, observed; ORR, objective response rate; PFS, progression‐free survival
