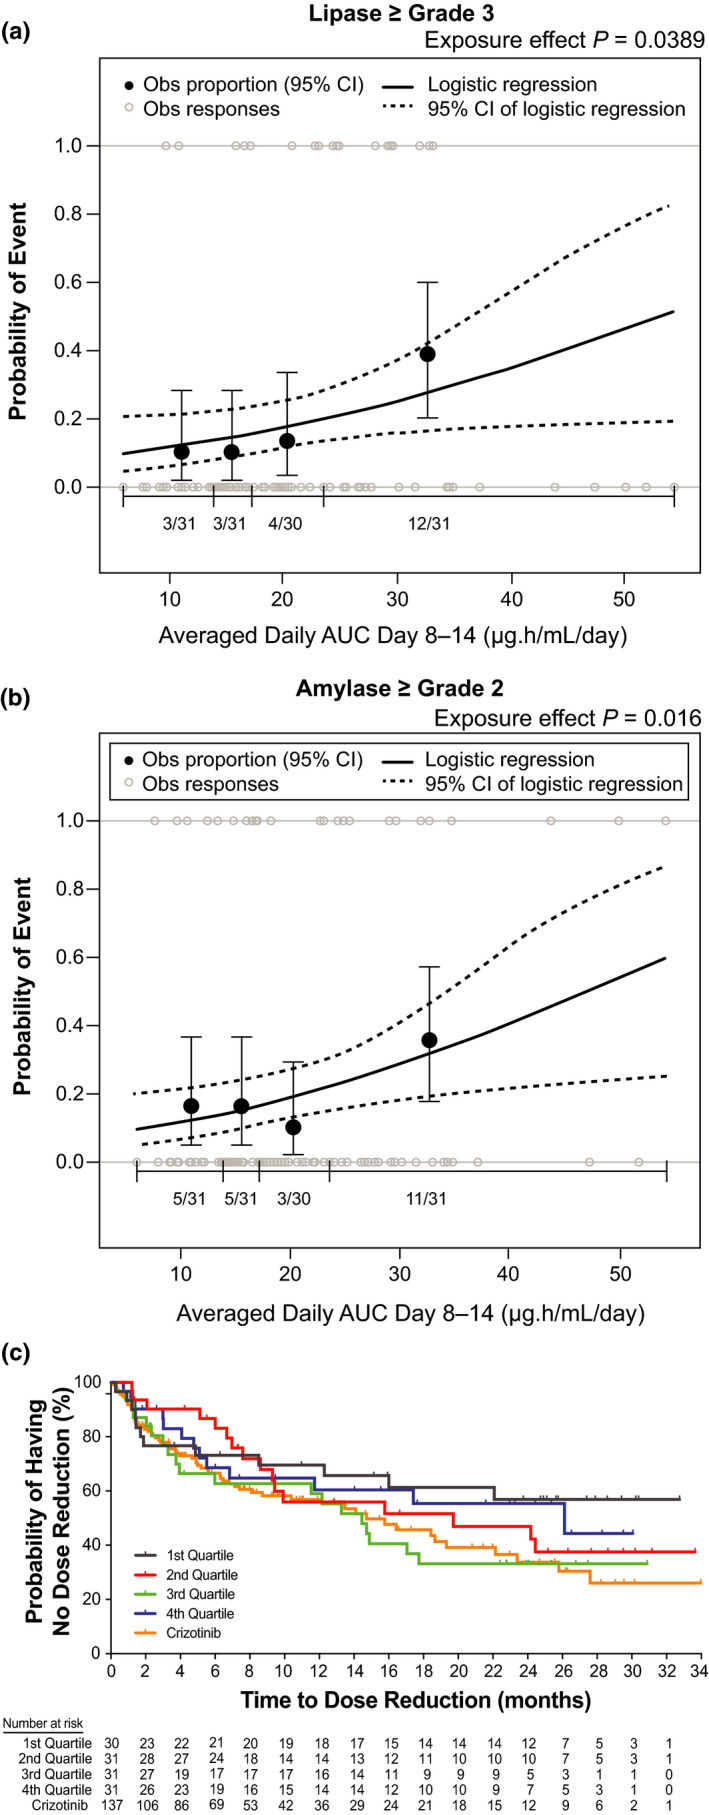
FIGURE 3.

Exposure‐safety analyses. Observed incidence and predicted probability of (a) grade ≥3 lipase increase and (b) grade ≥2 amylase increase as a function of brigatinib exposure. The relationship between time‐averaged AUC across days 8 to 14 of cycle one and AE probability was examined using logistic regression models. The analysis demonstrated a statistically significant relationship between exposure and grade ≥3 lipase increase and grade ≥2 amylase increase. (c) Kaplan‐Meier estimates for time to first brigatinib dose reduction stratified by time‐averaged AUC quartiles. To explore the relationship between brigatinib exposure and dose reductions, KM plots of time to first brigatinib dose reduction were generated for brigatinib exposure (time‐averaged AUC to the first occurrence of a dose reduction) quartiles. No discernible effect of brigatinib exposure on time to first brigatinib dose reduction was noted. Values for the crizotinib arm of the study are superimposed; however, no exposure values were available for crizotinib. Dotted curves represent the 95% CI of the logistic regression model prediction. The horizontal black line separated by vertical black solid lines denotes the brigatinib exposure range in each quartile. Black dots (vertical lines) represent the observed proportion of patients (95% CI) in each quartile. n/N is the number of patients with events/total number of patients in each quartile. Grey open circles represent observed individual data. AE, adverse event; AUC, area under the concentration‐time curve; CI, confidence interval; KM, Kaplan‐Meier; Obs, observed
