
FIGURE 4.
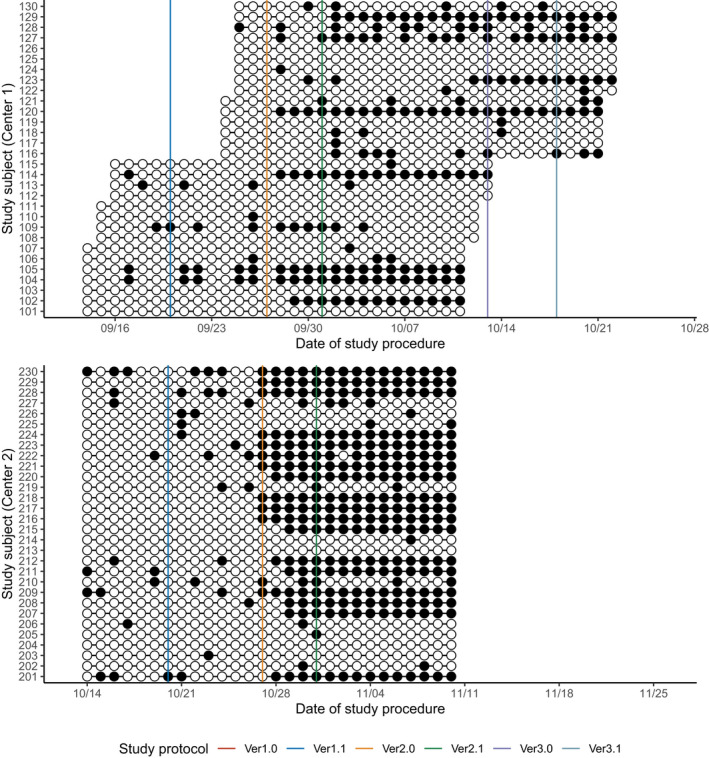
Summary of the drug adherence: adherence to the drug administration schedule. White circles (○) represent the administration of the study drug at the right schedule (within the scheduled time window) while black circles (●) represent the incorrect conducts. Solid vertical lines represent the scheduled date of each protocol amendment. There were no changes to the administration of drug during the study