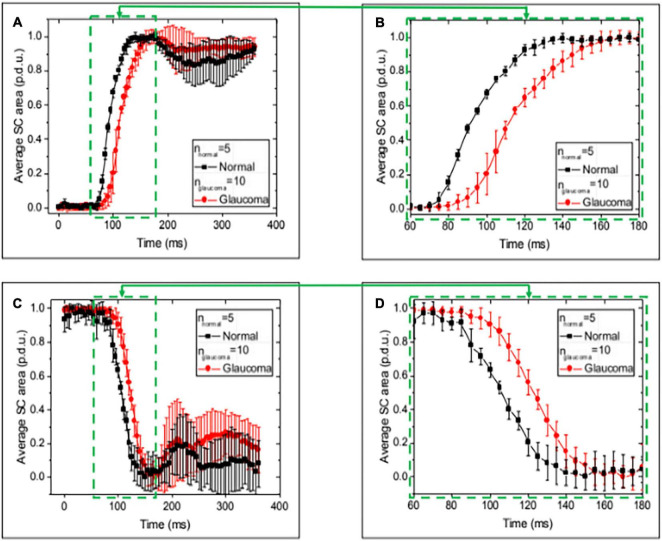
FIGURE 8.
Normal and glaucoma eye responses to Schlemm’s canal pressure changes. Images (A,C) show normalized SC cross-sectional area vs. time over a 400 ms time interval while imaging at 5-s intervals during the 0–30 and 30–0 mm Hg changes in reservoir pressures. Data are the mean and SEM for normal and glaucoma eyes. (B,D) Are an enlarged view of areas (A,C). The mean Schlemm’s canal area change occurred more rapidly in the normal than the glaucoma eyes at multiple time intervals. The total time to reach the peak or trough of motion was ≤200 ms. Oscillatory behavior remained a feature of the aggregated measurements at the end of both the rising and falling intervals. The mean time to a new peak or trough was ≤200 ms. Supplementary Table 2 provides a summary of baseline and final areas. MANOVA Δ for Normal vs. Glaucoma curves (p < 0.001).

