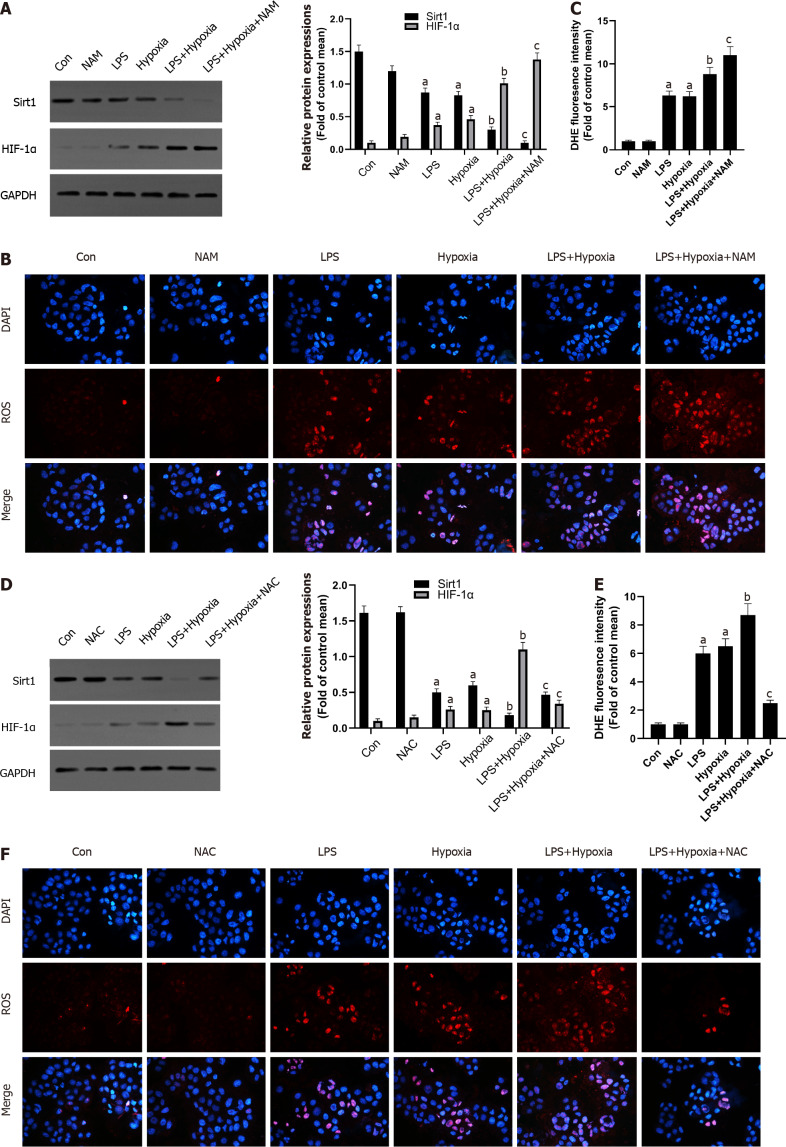
Figure 3.
The inhibition of Sirtuin1 induced activation of hypoxia inducible factor-1α and subsequently increased hypoxia-induced reactive oxygen species production. A: Western blotting was performed to measure the levels of Sirtuin1 (Sirt1) and hypoxia inducible factor (HIF)-1α in L02 cells; B: Reactive oxygen species (ROS) productions were detected by dihydroethidium (DHE) staining. Representative images of the DHE staining in different groups; C: ROS productions were evaluated by quantification of mean fluorescence intensity in DHE staining; D: Western blotting was performed to measure the levels of Sirt1 and HIF-1α in L02 cells; E and F: ROS productions were detected by DHE staining. Data shown are means ± standard deviations (SDs) of three separate experiments. aP < 0.05 vs Control group; bP < 0.05 vs Lipopolysaccharide (LPS)-treated group; cP < 0.05 vs LPS + Hypoxia-treated group; one-way analysis of variance with Bonferroni's post hoc test; the error bars indicate the SDs.

