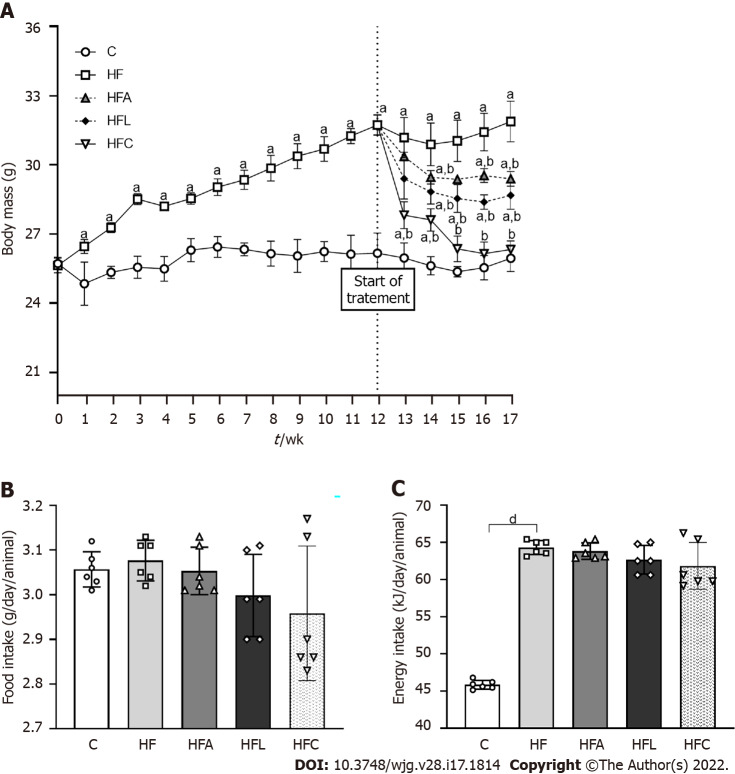
Figure 1.
Body mass and food behavior. A: Body mass evolution; B: Food intake; C: Energy intake. Brown-Forsythe and Welch one-way ANOVA and Dunnett T3 post hoc test (mean ± SD, n = 6). Significant differences are indicated as follows: aP < 0.05; bP < 0.01; dP < 0.0001. C: Control diet; HF: High-fat diet; HFA: High-fat diet plus PPAR-alpha agonist (WY14643); HFL: High-fat diet plus DPP-4 inhibitor (linagliptin); HFC: High-fat diet plus the combination of WY14643 with linagliptin.

