
FIGURE 1.
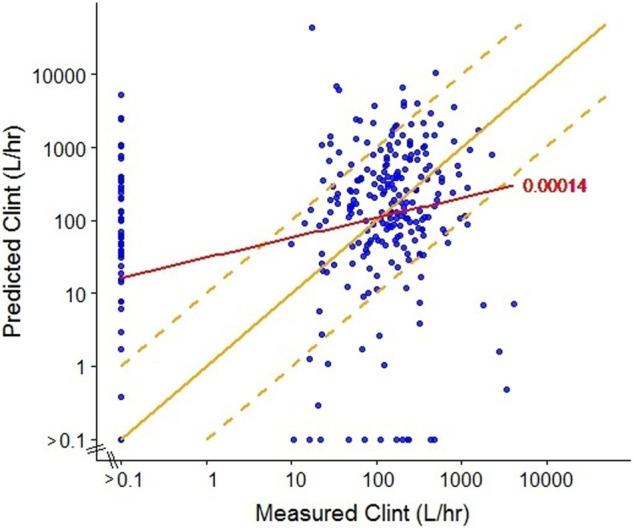
Comparison of measured (Wetmore et al., 2015) and predicted (ADMET predictor, ver7.1, SimulationsPlus) intrinsic clearance (CLint) for a subset of ToxCast chemicals. The red line represents the linear regression with R 2 = 0.00014. The solid yellow line represents equivalence between predicted and measured values (y = x) and the dashed yellow lines represent a 10-fold divergence between predicted and measured values (y = 10 × x; y = x/10).