
FIGURE 3.
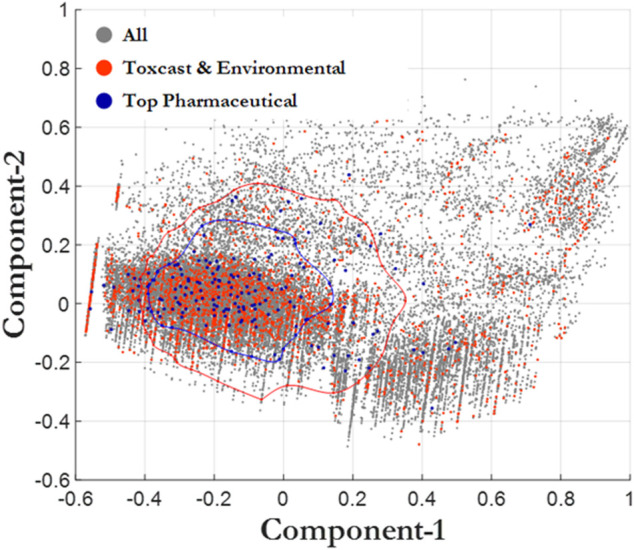
Principal component analysis. All chemicals (CERAPP, gray), environmental chemicals from ToxCast (red), and top prescribed drugs (blue). The blue bubble surrounds the Top Pharmaceutical compounds that are one standard deviation away from the mean. The red bubble surrounds the ToxCast and Environmental compounds that are one standard deviation away from the mean.