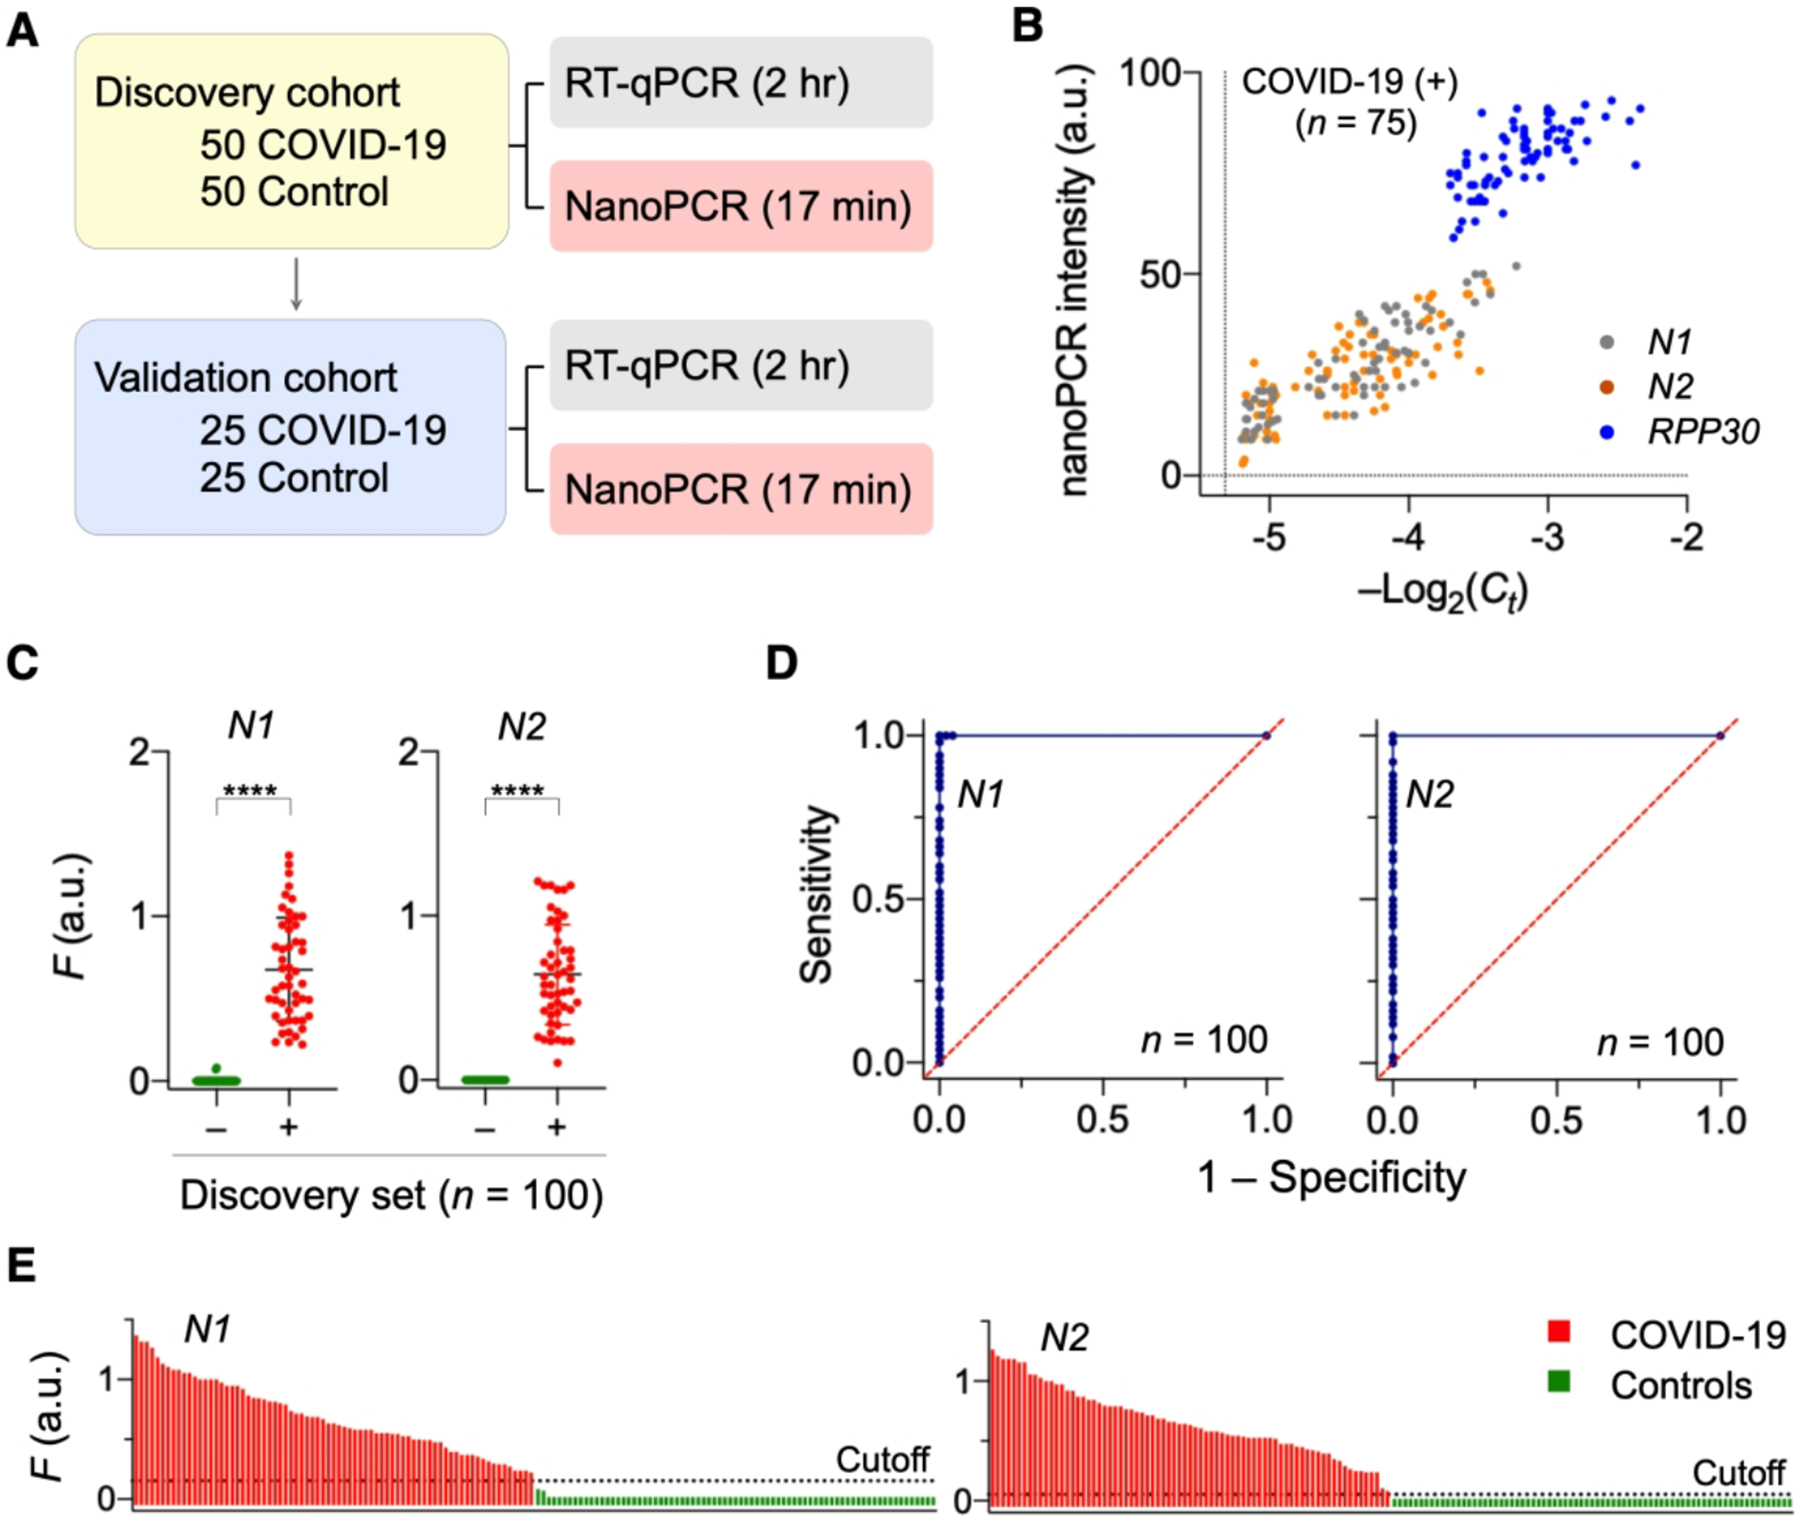
Figure 6. Clinical application of nanoPCR to COVID-19 diagnosis.

(A) Clinical study design (n = 150). First 100 samples were used as a discovery cohort while the other 50 samples a validation set. Each sample was aliquoted for nanoPCR and conventional RT-qPCR. (B) Analytical concordance between nanoPCR and RT-qPCR. The results for target genes were positively correlated (Pearson’s r values: rN1 = 0.87, rN2 = 0.78, rRPP30 = 0.70). (C) Analysis of the discovery cohort. Normalized signals (FN1 and FN2) from COVID-19 patients (+) were significantly higher than those from controls (−) (****P < 0.0001; two-sided t-test; n = 100). (D) Receiver operation characteristic (ROC) curves for the discovery cohort. The cut-off F values for N1 and N2 were determined from ROC curves. (E) Waterfall plots of FN1 and FN2 of the all samples (n = 150). Adapted with permission from ref 2. Copyright © 2020, The Authors, under exclusive licence to Springer Nature Limited.
