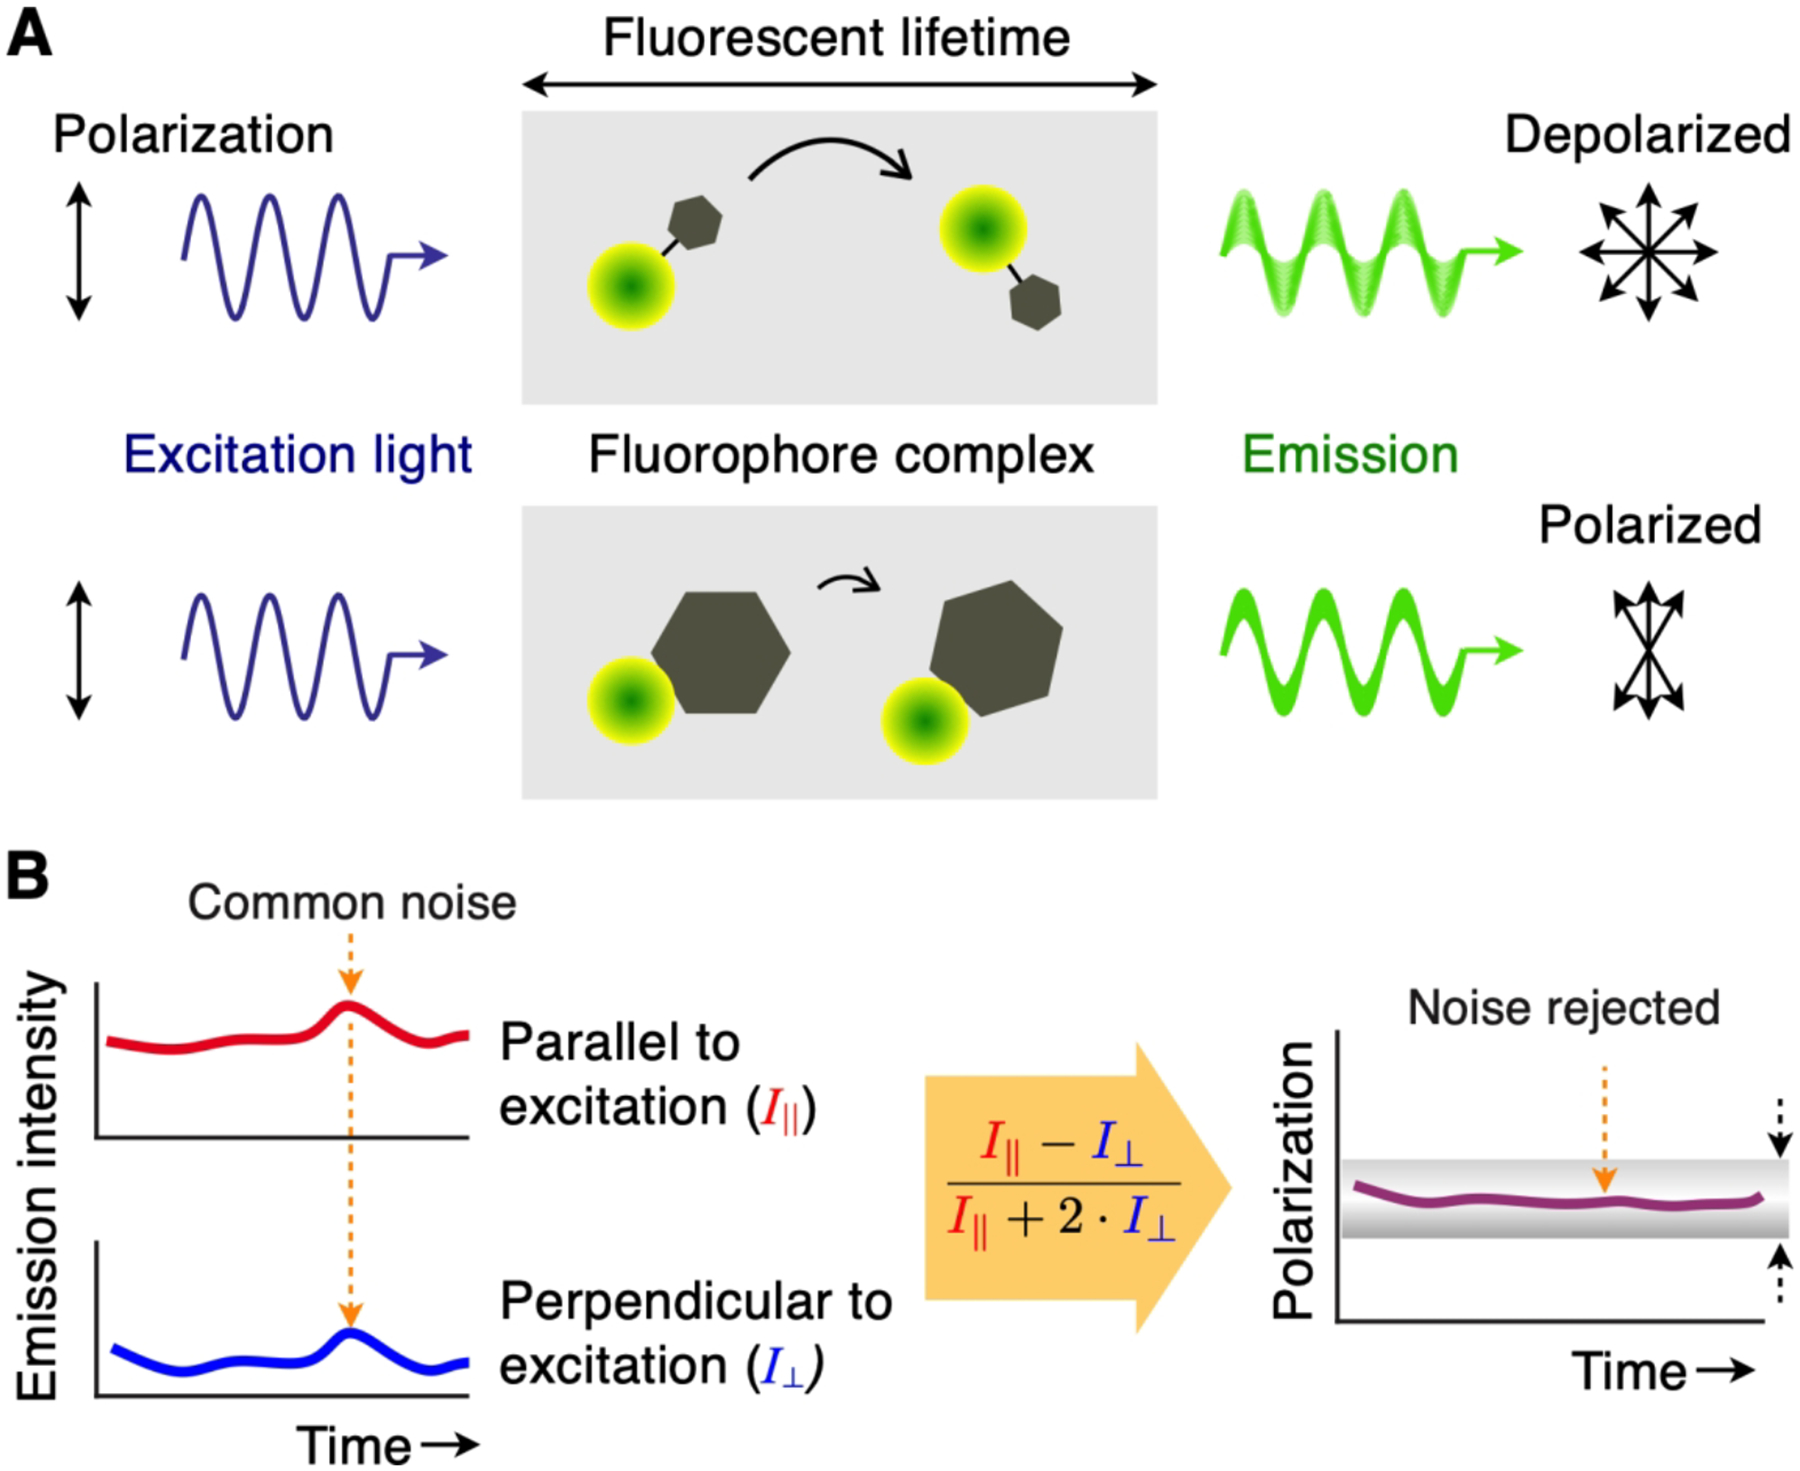
Figure 7. Overview of FP technique.

(A) Upon absorbing light (blue sinusoid), a fluorophore will emit longer-wavelength photons (green sinusoid) with identical polarization angles. If the fluorophore is small, it tumbles quickly during the fluorescence lifetime and the observed emission is depolarized (top). If the fluorophore binds a larger particle, the complex would rotate slowly and the emission light largely maintains the same polarization as the excitation light (bottom). (B) FP signal acquisition. Intensity readings from dual optical detectors are captured continuously, and a FP value is calculated in real-time. Common noise (dotted orange arrows) present on both channels is rejected due to the ratiometric nature of the measurement (i.e. the subtraction of parallel and perpendicular signals). In addition, the measured FP value can be monitored to ensure that its variance is within a threshold (dotted black arrows), which guards against temporal or momentary noise.
