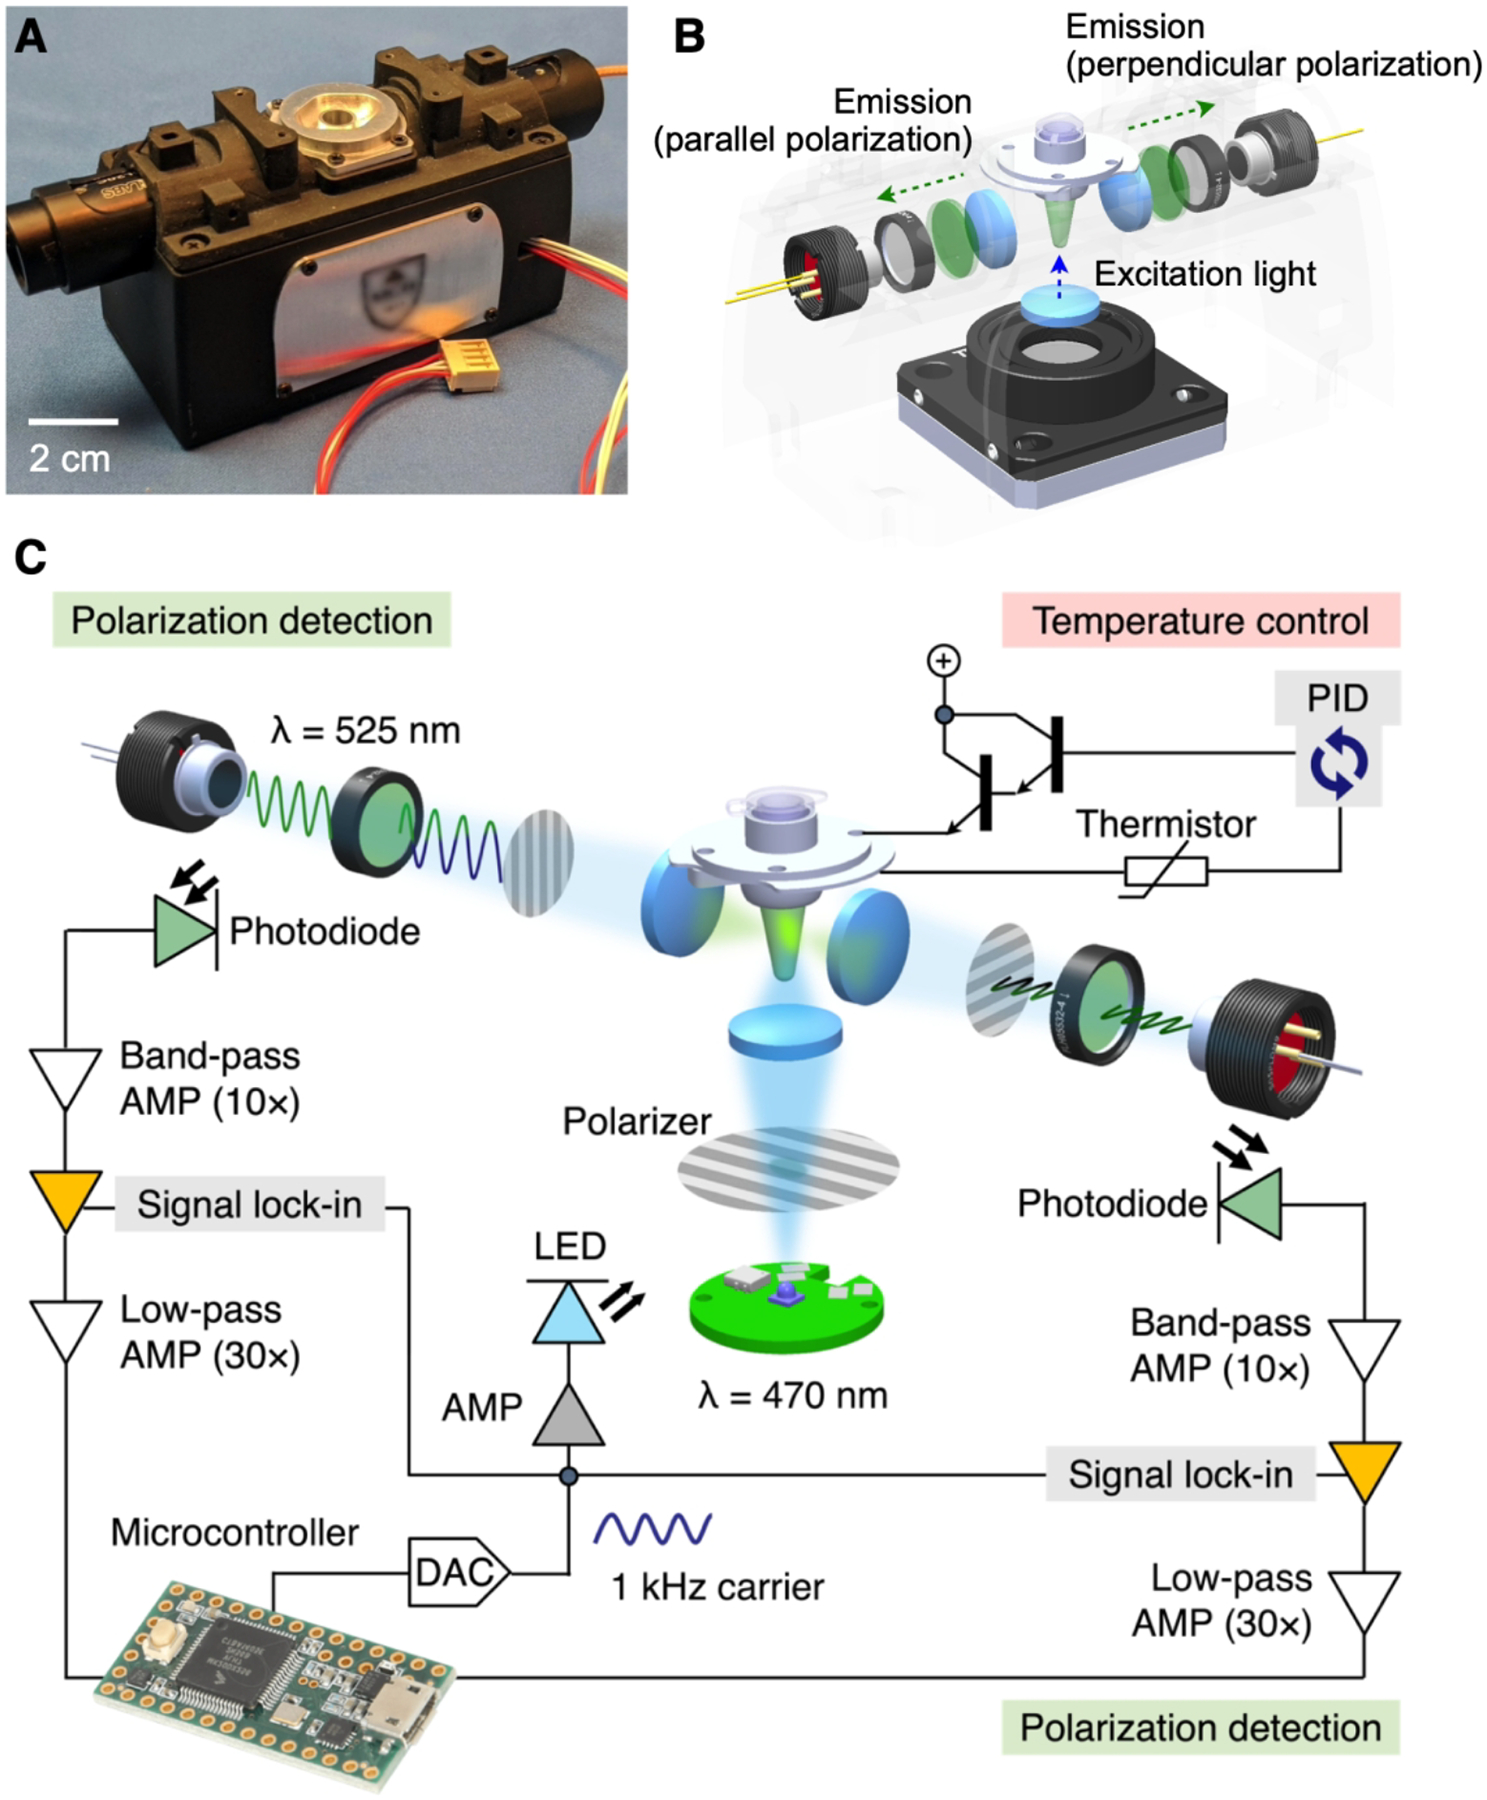
Figure 8. FP detection system.

(A) Photograph of the portable device for onsite FP detection. (B) FP optics. A linearly polarized light illuminates a sample from its bottom side. Two photodetectors measure orthogonal polarization of fluorescent emission from the sample. (C) To enhance the signal-to-noise ratio (SNR), the system uses the optical lock-in detection. The sample is illuminated with linearly polarized light oscillating at 1 kHz. Fluorescence is measured by two photodetectors, each consisting of a photodiode, a 525 nm bandpass filter and a linear polarizer. The signal is processed by a sequence of integrated filtering/amplification steps: 10 × band pass, lock-in, and 30 × lowpass. Sample’s temperature can be controlled through a feedback loop control. AMP, amplifier; DAC, digital-to-analog converter; PID, proportional–integral–derivative. Adapted with permission from ref 4. Copyright © 2021 Elsevier B.V. All rights reserved.
