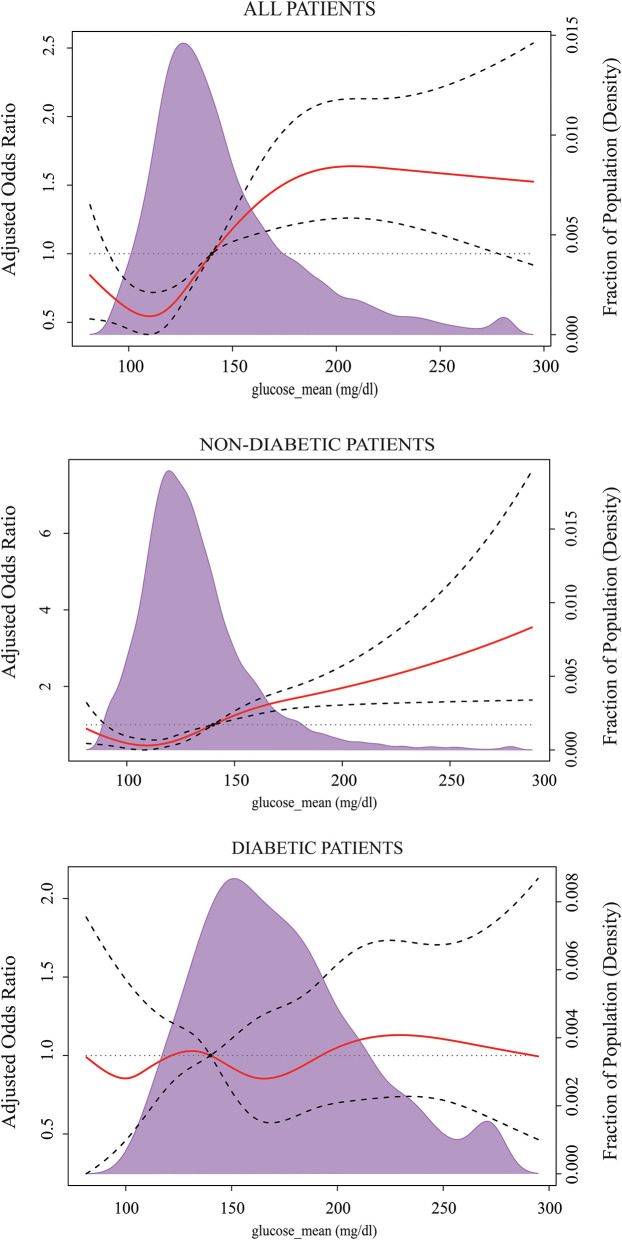
Figure 2.
Multivariable-adjusted odds ratios for ICU mortality according to the levels of the mean blood glucose (MBG) on a continuous scale. Solid red lines are multivariable-adjusted odds ratios, with dashed bold lines showing 95% confidence intervals derived from restricted cubic spline regressions with five knots. Reference lines for no association are indicated by the black dashed lines at a hazard ratio of 1.0, and the reference knot set at 140 mg/dl. Purple regions indicate the fraction of the population with different levels of MBG. Adjustment factors are the same as those in Model 3 of Table 2.

