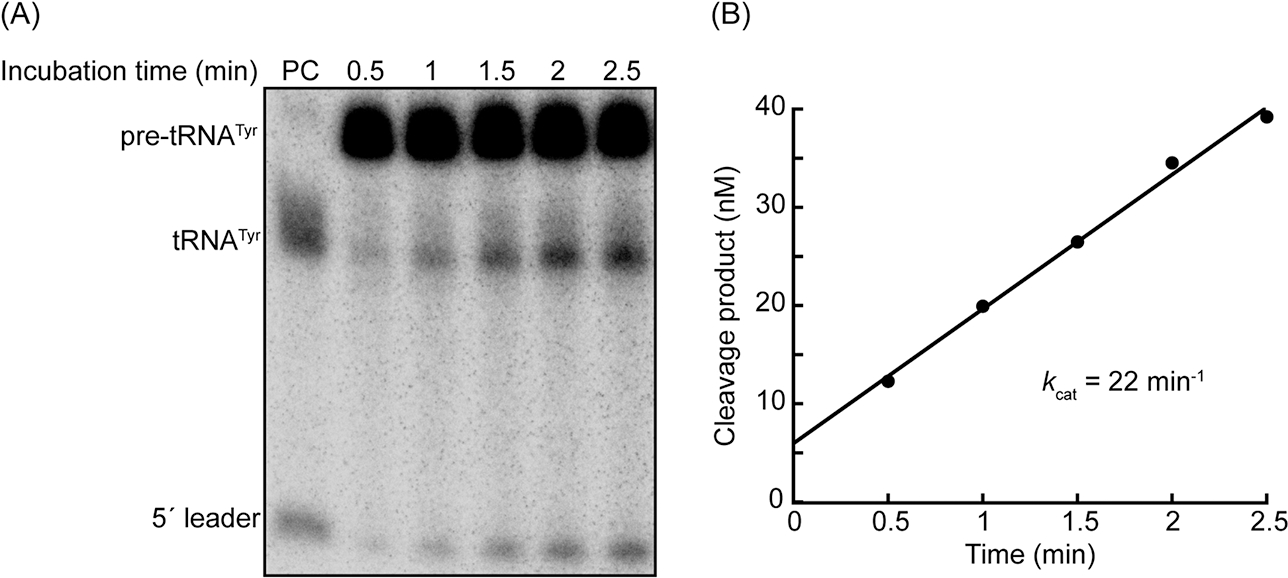
Figure 3. Measuring the pre-tRNA cleavage activity of M. maripaludis RNase P.

(A) Representative 8% (w/v) polyacrylamide, 7 M urea gel image illustrating cleavage of 250 nM E. coli pre-tRNATyr by 0.625 nM M. maripaludis RNase P (RPR + 5 RPPs). A trace amount of internally-[α-32P]-radiolabeled pre-tRNATyr was added to the assay mix to track the progress of the cleavage reaction. The PC (positive control) lane contains substrate that was cleaved for 15 min at 37°C by E. coli RNase P. The cleavage products in this lane serve as migration markers to confirm that M. maripaludis RNase P cleaves the pre-tRNA substrate at the expected site. (B) Representative plot of cleavage product concentration versus time. The volumes of each of the bands in (A) were calculated using ImageQuant software (Molecular Dynamics). The percentage of cleavage product at each time point was calculated using the band volumes as follows: %cleavage = [(tRNAtyr) + (5′ leader)]/[(Pre-tRNATyr) + (tRNATyr) + (5′ leader)]. The resulting values were multiplied by the total substrate concentration at the beginning of the reaction (250 nM). The resulting concentrations are plotted against time. A straight line was fit to the data, and the resulting slope was divided by enzyme concentration to yield kcat.
