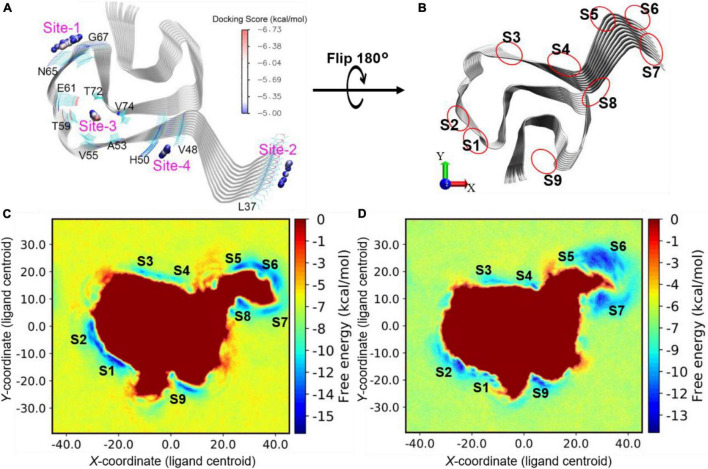
FIGURE 8.
(A) Blind docking identified sites (labeled from “Site-1” - “Site-4”) with favorable docking scores (<–5 kcal/mol) for DABTAs and DCVJ. The geometrical centers of the docked ligands are depicted as small spheres and colored by the range of docking scores. (B) Illustration of sites identified by metadynamics simulations. (C) Free energy profile for d4 binding onto the surface sites of α-syn. (D) Free energy profile for d8 binding onto the surface sites of α-syn. The free energy local minima are named with “S” combined with identity numbers.

