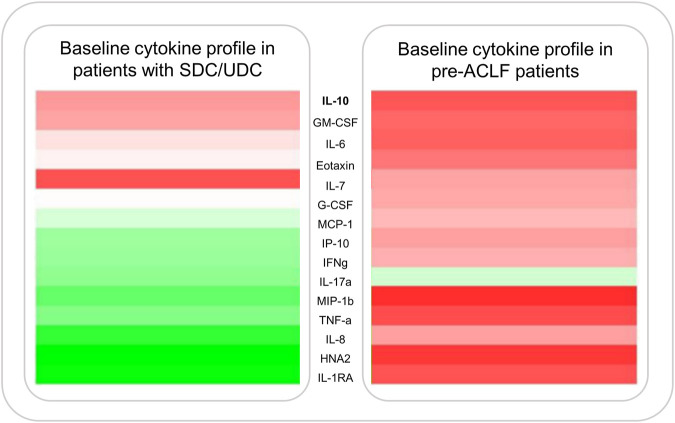
FIGURE 3.
Cytokine expression profiles displayed as a heatmap in patients with AD and pre-ACLF. Figure shows median plasma levels of various pro-inflammatory cytokines at enrollment of 503 patients admitted with SDC/UDC or pre-ACLF. Data published by Trebicka et al. (27).

