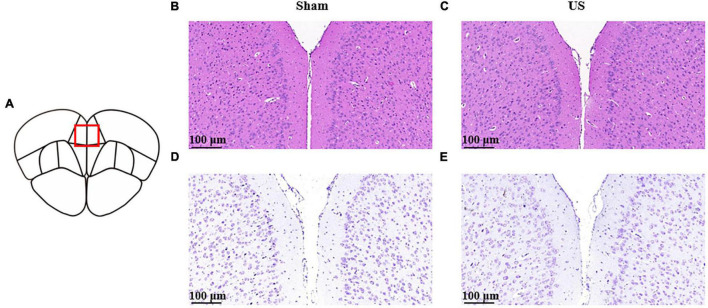
FIGURE 7.
Histological analyses of PFC brain sections for the evaluation of tissue damage in sham and US-treated mice (without LPS injection). (A) Schematic diagram of brain sections. Representative images of hematoxylin and eosin staining in sham (B) and US-treated (C) mice. Representative images of Nissl staining in sham (D) and US-treated (E) mice (n = 3 in each group). PFC, prefrontal cortex; US, ultrasound stimulation; LPS, lipopolysaccharide.

