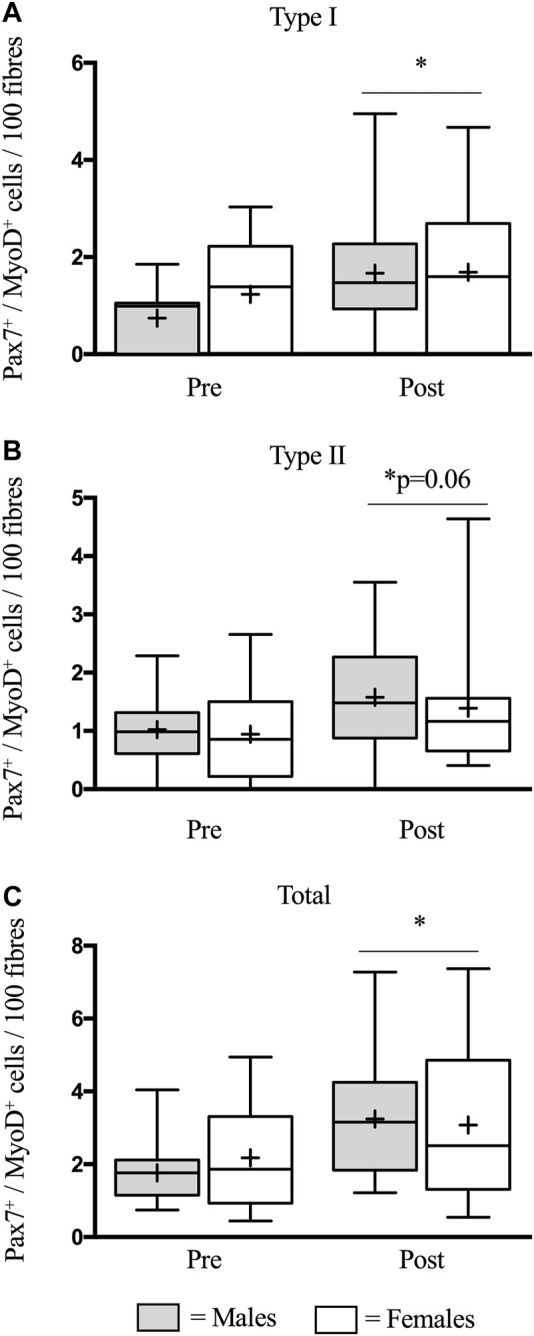
FIGURE 3.

Mean number of activated satellite cells (SCs) per muscle fibre in type I (A), type II (B), and total (C) muscle fibres before (pre) and 48 h (post) following eccentric damage. The box-and-whisker plot displays the median (line) and the mean (+), with the box representing the interquartile range (IQR), and the whiskers representing the maximum and minimum values. * indicates a significant effect of time (p < 0.05).
