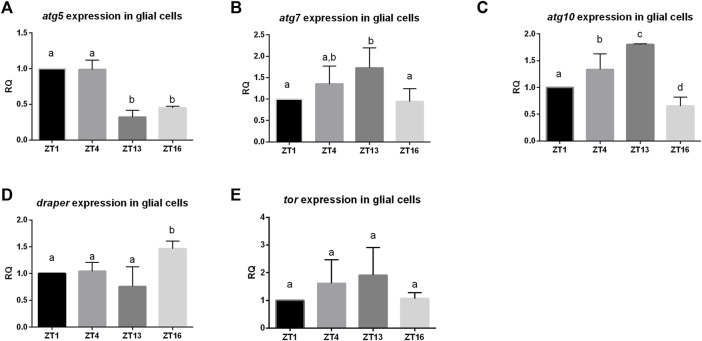
FIGURE 1.
Daily pattern of expression of genes involved in autophagy in glia. Glia cells were sorted out at selected time points (ZT1,ZT4, ZT13, ZT16). qPCR data were calculated as ΔΔCT and normalized to ZT1 as 1. Statistically significant differences are marked as letters: different letters above two bars mean there is statistically significant difference. Genes analysed: (A) atg5 (B) atg7, (C) atg10 (D) draper, (E) tor.

