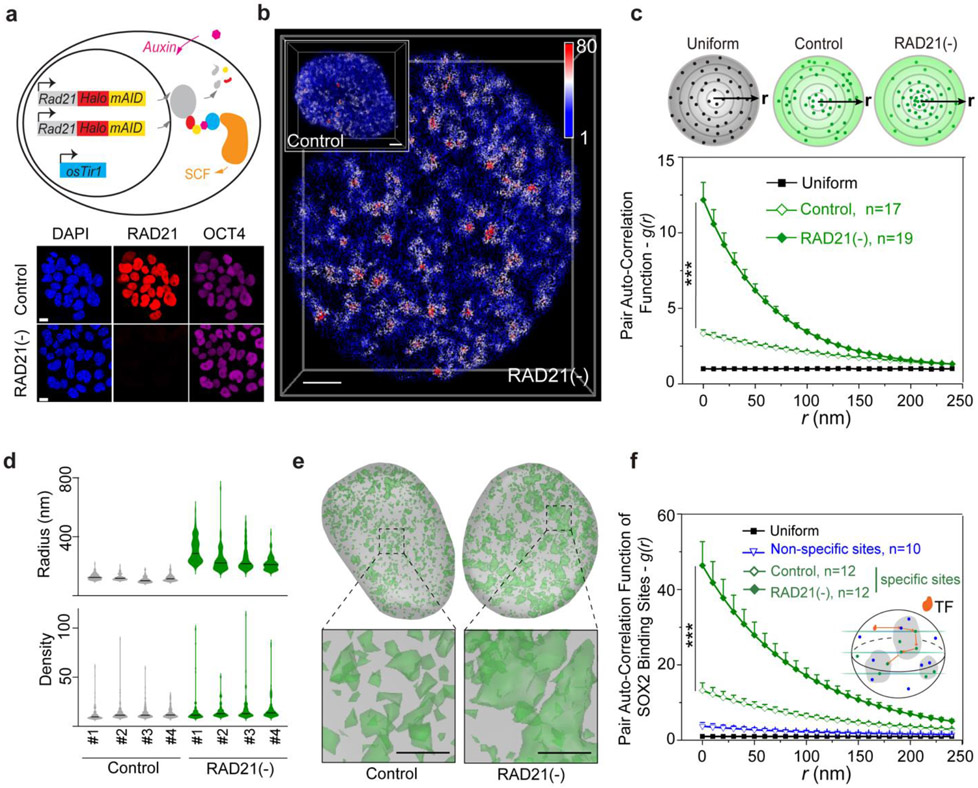
Fig.1 ∣. Cohesin prevents accessible chromatin from spatial mixing.
(a) (Upper panel) A schematic of acute depletion of Cohesin in mouse ESCs by the auxin-induced protein depletion system. The mini auxin-inducible degron (mAID)-HaloTag was bi-allelically knocked into the C-terminus of Rad21 gene (Cohesin subunit) by CRISPR/Cas9 in mESCs stably expressing the plant derived E3 ligase adaptor protein osTir1. (Lower panel) Adding plant derived hormone analogue (auxin) triggers rapid degradation of target protein RAD21 as revealed by single cell fluorescence imaging (HaloTag ligand JF549). OCT4 immunostaining was used as a control. Scale bar, 5 μm.
(b) Single-cell illustration of 3D ATAC-PALM localizations upon RAD21 depletion. A wild type control cell is also shown in the upper left corner. The color bar indicates localization density calculated by using a canopy radius of 250 nm. The experiments have been independently repeated for four times. Also see the 3D rotatory presentation in Supplementary Movie 1. Scale bar, 2 μm.
(c) RAD21 depletion promotes global increase of accessible chromatin clustering measured by pair auto-correlation function, which describes the similarity among observations. The top panel shows a simplified two-dimensional scheme for distribution of localizations in uniform (black dots, left) or wild type (green dots, middle) or RAD21 depleted (green dots, right) conditions. g(r) represents the pair autocorrelation function of distance r calculated from a given origin point inside the space. The error bar represents standard error (SE) of the mean and two-sided Mann-Whitney U test was applied for comparing data points at g(0).
(d) The violin plot of normalized radius (upper panel) or localization density (lower panel) of top 100 ranked ACDs among 4 individual cells for Control and RAD21 depleted conditions. The localization density was determined by the total number of ATAC-PALM localizations within a 250nm(radius) spherical region. The black bar indicates the median value for each data set.
(e) 3D iso-surface reconstruction of ACDs (green) identified by using the DBSCAN algorithm for Control (left panel) and RAD21 depletion (right panel) conditions. The iso-surface in grey outlines the nuclear envelope. The lower panels show 4× magnification of local regions under each condition. Scale bar, 1 μm.
(f) Enhanced clustering of transcription factor (TF) SOX2 stable binding sites upon RAD21 depletion. The pair auto-correlation function g(r) for stable SOX2 binding sites was calculated before and after RAD21 depletion. SOX2 binding events with dwell times longer than 4s were considered as stable binding events (see methods). The error bars represent standard error (SE) of the mean. The two-sided Mann-Whitney U test was used for statistical testing. The inset illustrates the 3D TF binding between specific (green) and non-specific (blue) binding sites.

