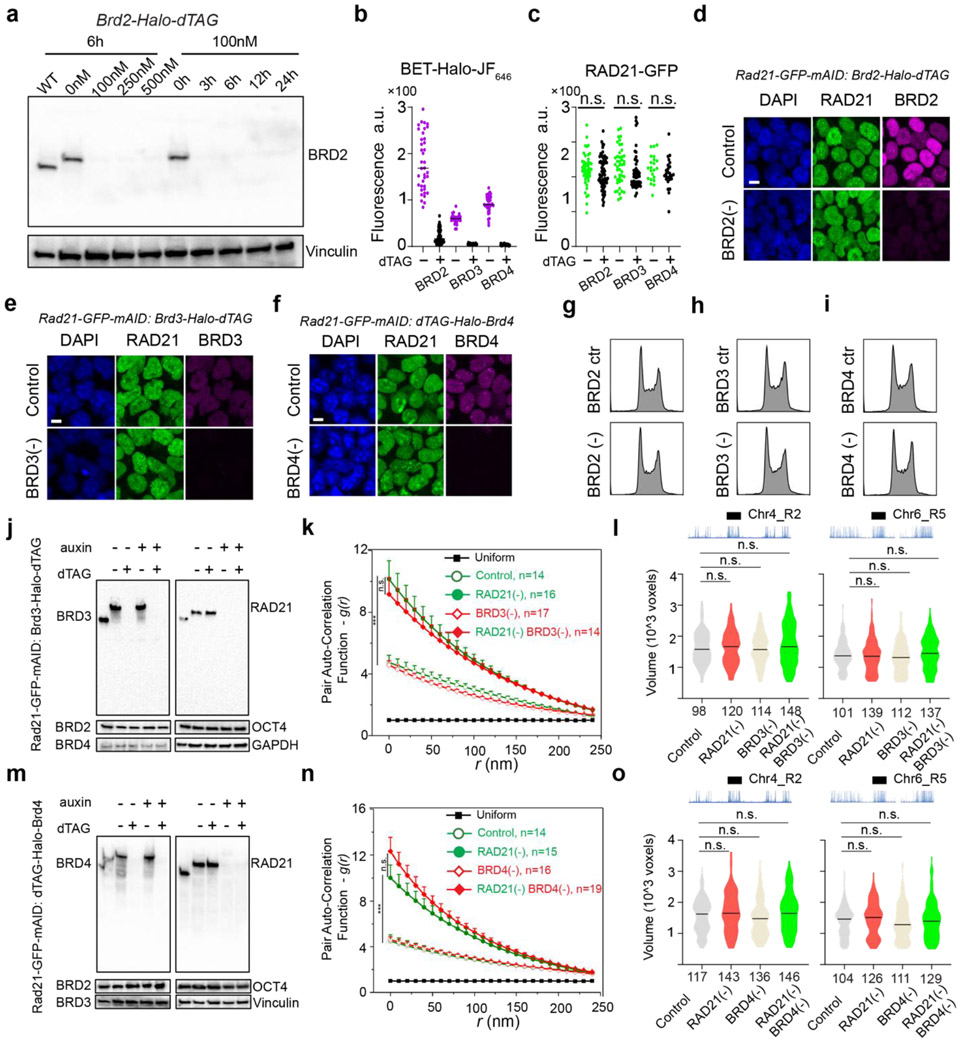
Extended Data Fig.6 ∣. Characterization of acute BET family protein depletion on the spatial organization of the accessible genome. Related to Fig.2.
(a) WB test of time and dose-dependent degradation of protein levels of endogenous BRD2-dTAG. 100nM dTAG13 is sufficient to deplete BRD2 as early as 3 hours. We used 100nM dTAG13 treatment for 6 hours throughout the current study.
(b-c) Quantification of single cell fluorescence of endogenously labeled HaloTag-BRD2/3/4-using HaloTag ligand JF646 before and after dTAG13 treatment for 6 hours (b). RAD21 GFP signal serves as the control (c).
(d-f) Representative images of acute degradation of BRD2 (d), BRD3 (e) and BRD4 (f) after 6 hours of dTAG13 treatment. Endogenous BET proteins were engineered with a HaloTag and labeled with 500nM JF646. The RAD21 level was monitored by GFP. Scale bar,5 μm.
(g-i) Cell cycle analysis after 6 hours depletion of BRD2, BRD3 or BRD4 by propidium iodide staining. Histograms of the DNA content distribution measured by propidium iodide staining are shown.
(j) WB analysis of protein levels of endogenous BRD3-dTAG or RAD21-AID individually or in combination after 6 hours of dTAG13 or auxin treatment, respectively.
(k) Depletion of BRD3 for 6 hours did not significantly reduce the accessible chromatin clustering after RAD21 depletion. g(r) curves were plotted for indicated conditions. The two-sided Mann-Whitney U test was used for statistical testing.
(l) Violin plot of 3D volumes (the number of voxels) of two ATAC-rich segments R2 (left) and R5 (right) before (grey) and after (red) BRD3 depletion, RAD21 depletion or in combination. The number of alleles analyzed is indicated at the bottom. The black bar indicates the median value for each data set and Mann-Whitney U test was performed for the statistical analysis. n.s.,not significant.
(m) WB analysis of protein levels of endogenous BRD4-dTAG or RAD21-AID individually or in combination after 6 hours of dTAG13 or auxin treatment, respectively.
(n) Degradation of BRD4 for 6 hours did not significantly reduce but instead had a trend to increase the accessible chromatin clustering after RAD21 depletion. g(r) curves were plotted for indicated conditions. The two-sided Mann-Whitney U test was used for statistical testing.
(o) Violin plot of 3D volumes (the number of voxels) of two ATAC-rich segments R2 (left) and R5 (right) before (grey) and after (red) BRD4 depletion, RAD21 depletion or in combination. The number of alleles analyzed is indicated at the bottom. The black bar indicates the median value for each data set and Mann-Whitney U test was performed for the statistical analysis.

