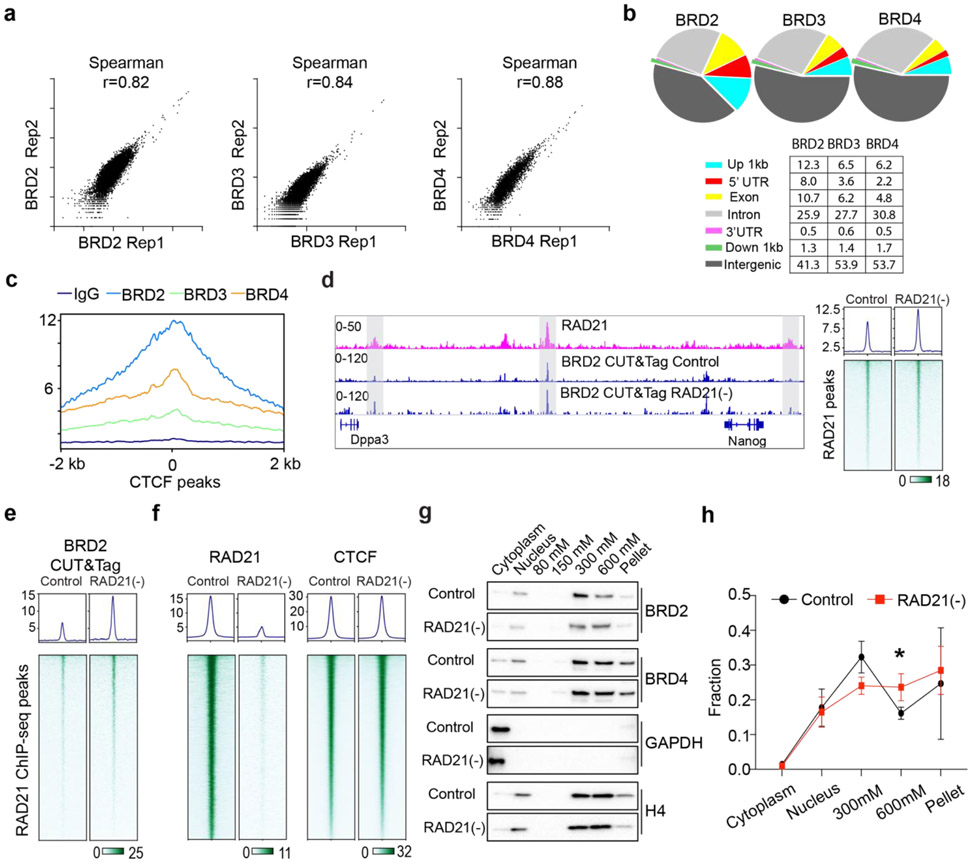
Extended Data Fig.9 ∣. Genomic and biochemical analysis of BET family proteins. Related to Fig.3.
(a) Scatter plot of two biological replicates of ChIP-seq signal for BRD2, BRD3 and BRD4. Ranked spearman correlation coefficient is shown above each plot.
(b) Pie diagram of different genomic binding features of BRD2, BRD3 and BRD4 extracted from their respective ChIP-seq peak signal. The percentage of BET proteins binding to different genome features are summarized in the table on the bottom.
(c) Enrichment of BET protein ChIP-seq signal at CTCF sites was performed using k-means clustering (n=2, enriched and non-enriched). BRD2 has the highest enrichment profile among BET proteins at CTCF sites at the binding-enriched cluster.
(d) (Left panel) Representative genome browser track of Cohesin ChIP-seq (magenta) and BRD2 CUT&Tag (blue) before and after Cohesin depletion (RAD21(−)). Shaded area demonstrates the increased BRD2 signal at Cohesin binding peaks. (Right panel) BRD2 enrichment and heatmap analysis by CUT&Tag (Cell Signaling, 5848S) at Cohesin ChIP-seq peaks before and after Cohesin depletion.
(e) Genome wide heatmap analysis of BRD2 CUT&Tag enrichment at Cohesin ChIP-seq peaks before and after Cohesin depletion by using a different antibody (Bethyl laboratories, A302-583A).
(f) ChIP-seq analysis of RAD21 and CTCF after 6 hours Cohesin depletion. Shown are the enrichment profile (upper panel) and heatmap (lower panel) of each protein over its binding peaks.
(g) Chromatin fractionation assay of BRD2 and BRD4 in non-treated Control and RAD21 depletion conditions after different salt extraction of ESC nuclei followed by western blot analysis. GAPDH and Histone H4 was used as marker for the cytoplasmic and chromatin bound fraction, respectively. In control cells, BRD2 is preferentially extracted from the 300mM NaCl concentration. After Cohesin depletion, more BRD2 is extracted from the 600mM NaCl concentration.
(h) Summary of the relative BRD2 enrichment in different chromatin fractionations before and after RAD21 depletion from 4 replicates. Each fraction is normalized to histone H4 abundance. * indicates p < 0.05 by non-parametric Mann-Whitney test. Error bar represents standard deviation.
The non-parametric Mann-Whitney U test was used for statistical testing. *, p < 0.05.

