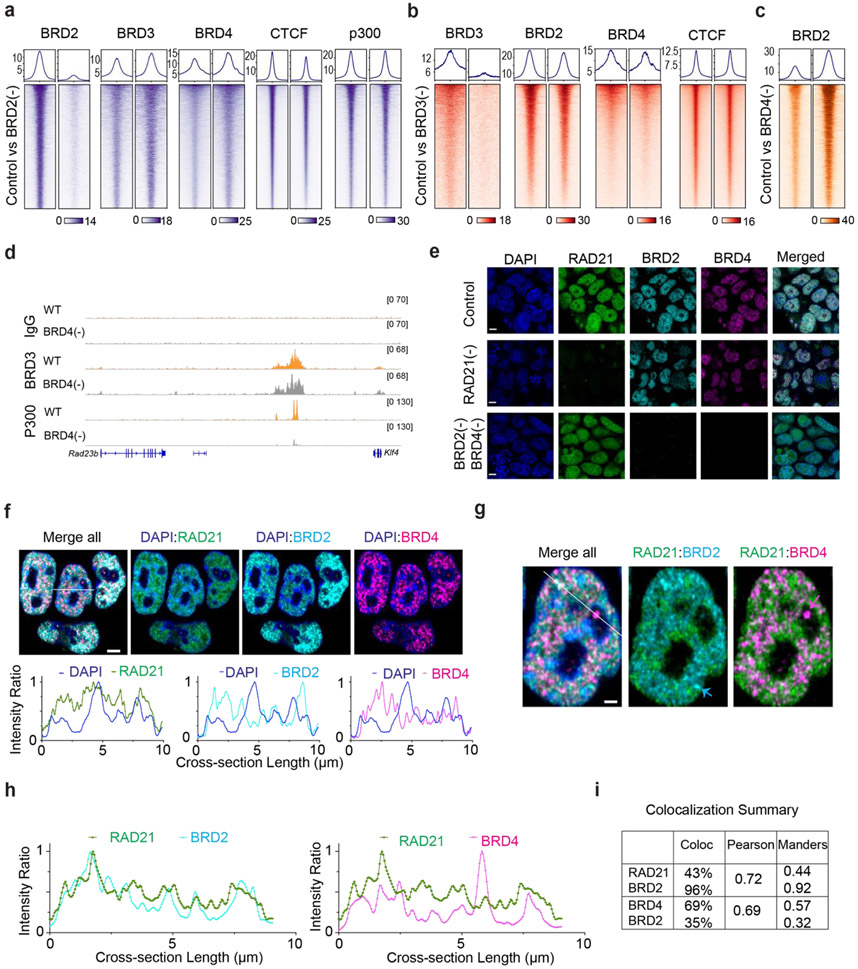
Extended Data Fig.10 ∣. BRD4 regulates BRD2 chromatin binding and function. Related to Fig.4.
(a) Enrichment profile and heatmap of BRD2/3/4, CTCF, P300 ChIP-seq signal at their respective binding peaks before and after BRD2 depletion.
(b) Enrichment profile and heatmap of ChIP-seq signal of BRD2, BRD3, BRD4 and CTCF at their cognate binding peaks after 6 hours of BRD3 depletion.
(c) Heatmap of BRD2 binding signal specifically at BRD2/BRD4 co-bound regions before and after acute BRD4 depletion for 6 hours.
(d) Representative genomic tracks (from integrated genomics viewer) of IgG, BRD3 and p300 after BRD4 depletion. BRD4 depletion markedly reduced P300 binding.
(e) Validating the specificity of fluorescence signal or antibodies used for immunofluorescence after acute depletion of RAD21 or BRD2/BRD4. The RAD21-mAID-eGFP : BRD2-HA-dTAG : BRD4-Halo-dTAG triple degron mESC line was used in this study. RAD21 was detected by covalently tagged eGFP signal. BRD2 was detected by mouse monoclonal anti-HA antibody and goat-anti-mouse Alexa568 secondary antibody. BRD4 was detected by rabbit BRD4 primary antibody and goat-anti-rabbit Alexa647 secondary antibody. To validate the fluorescence signal specificity, RAD21 and BRD2/BRD4 were depleted by adding auxin (500μM) or dTAG13 (100nM) for 6 hours, respectively.
(f) (Upper panel) Representative images of spatial distribution of RAD21, BRD2 and BRD4 signal. (Lower panel) Fluorescent Intensity profile of RAD21(green), BRD2 (cyan) and BRD4 (magenta) relative to DAPI (blue). RAD21 is enriched at both DAPI high and low regions whereas BRD2 and BRD4 are enriched at DAPI low regions. Scale bar, 3μm.
(g) Representative single cell view of Cohesin (RAD21, green), BRD2 (cyan) and BRD4 (magenta) in their merged view. The while line indicates the cross-sectional line to analyze the fluorescent intensity profile. The cyan arrow indicates the BRD2 puncta showing little colocalization with BRD4. The magenta arrow indicates the BRD4 puncta poorly colocalized with BRD2. Scale bar, 1μm.
(h) Fluorescence intensity profile of Cohesin (RAD21, green), BRD2(cyan) and BRD4 (magenta) along the while line in (g).
(i) Whole nucleus 3D voxel-to-voxel correlation summary of RAD21 vs BRD2 and BRD4 vs BRD2 as shown in Fig.4c. The percentage of voxel colocalization of protein pair, the Pearson’s coefficient, and the Manders’ coefficient are computed and summarized.

