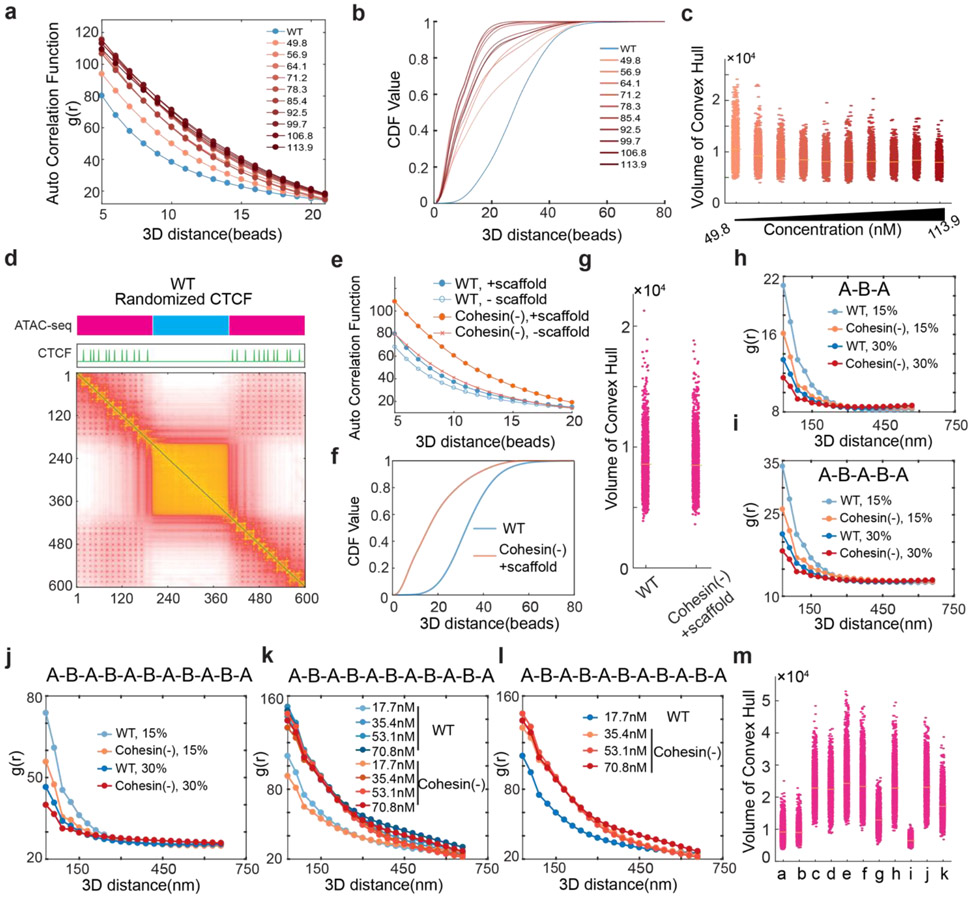
Extended Data Fig.12 ∣. Robustness of the polymer model that incorporates both loop extrusion and scaffold protein-mediated chromatin interactions. Related to Fig.5.
(a-c) Testing the robustness of the polymer model by varying the scaffold protein concentrations from 21.3nM (WT) to 113.9nM. Once passing a certain threshold (56.9nM), simulations show minimal impact of scaffold concentrations on the pair auto-correlation function g(r) (a), the cumulative distribution function (CDF) of 3D distance between neighboring active segments (b), and distributions for the volume of the convex hull for individual ATAC-rich segment (c). The yellow bar represents mean value.
(d-g) Testing the robustness of the polymer model by changing the distribution of CTCF sites on the ATAC-rich segment. (d) Contact probability map for the WT condition in which the CTCF beads are randomized. (e) Simulations here also demonstrate that randomized CTCF site distribution on active chromatin does not change the pair auto-correlation function g(r) as shown in Fig.7b. (f) CDF of 3D distance between neighboring active segments after Cohesin loss with randomized CTCF sites. (g) distributions for the volume of the convex hull for individual ATAC-rich segments after CTCF sites randomization. The yellow bar represents mean value.
(h-j) Simulation results are robust with respect to the varying model setups. Pair auto correlation function g(r) for system with different sizes A-B-A (h), A-B-A-B-A (i), A-B-A-B-A-B-A-B-A-B-A (j) and chromatin volume fraction (15% with lighter color, 30% with denser color) for wild type (WT, in blue) and Cohesin depletion (Cohesin (−), in red).
(k) g(r) showing various protein concentration for WT (blue) and Cohesin depletion (red) of system A-B-A-B-A-B-A-B-A-B-A with 15% chromatin volume fraction. Protein concentration from low to high are marked with colors from light to dense.
(l) Testing the robustness of the polymer model by varying system setup from A-B-A to A-B-A-B-A-B-A-B-A-B-A with chromatin volume fraction of 15%, and various protein concentration. g(r) showing various protein concentration for WT (blue) and Cohesin depletion (red) are marked with colors from light to dense to represent protein concentration from low to high.
(m) The protein-DNA interaction, multivalency, and optimal protein-protein interactions are required to maintain the ATAC-rich segment configuration upon Cohesin removal. Simulation for the volume of the convex hull of ATAC-rich segments under different perturbation conditions. The panels from left to right show the results of (a) Wild type, and Cohesin depletion with (b) current model setup, (c) no protein-DNA interaction, (d) no protein-protein interaction, (e) scaffold protein with only one interaction segment (lacking multivalency), (f) reduced protein-protein interaction strength (2kT), (g) increased protein-protein interaction strength (4kT), (h) reduced protein-DNA interaction strength (2kT), (i) increased protein-DNA interaction strength (6kT), (j) reduced protein-protein interaction strength (2kT) with higher protein concentration, (k) increased protein-protein interaction strength (4kT) with low protein concentration. k is the Boltzmann constant and T is the temperature. See more details in the Robustness of simulation parameters in the methods section.

