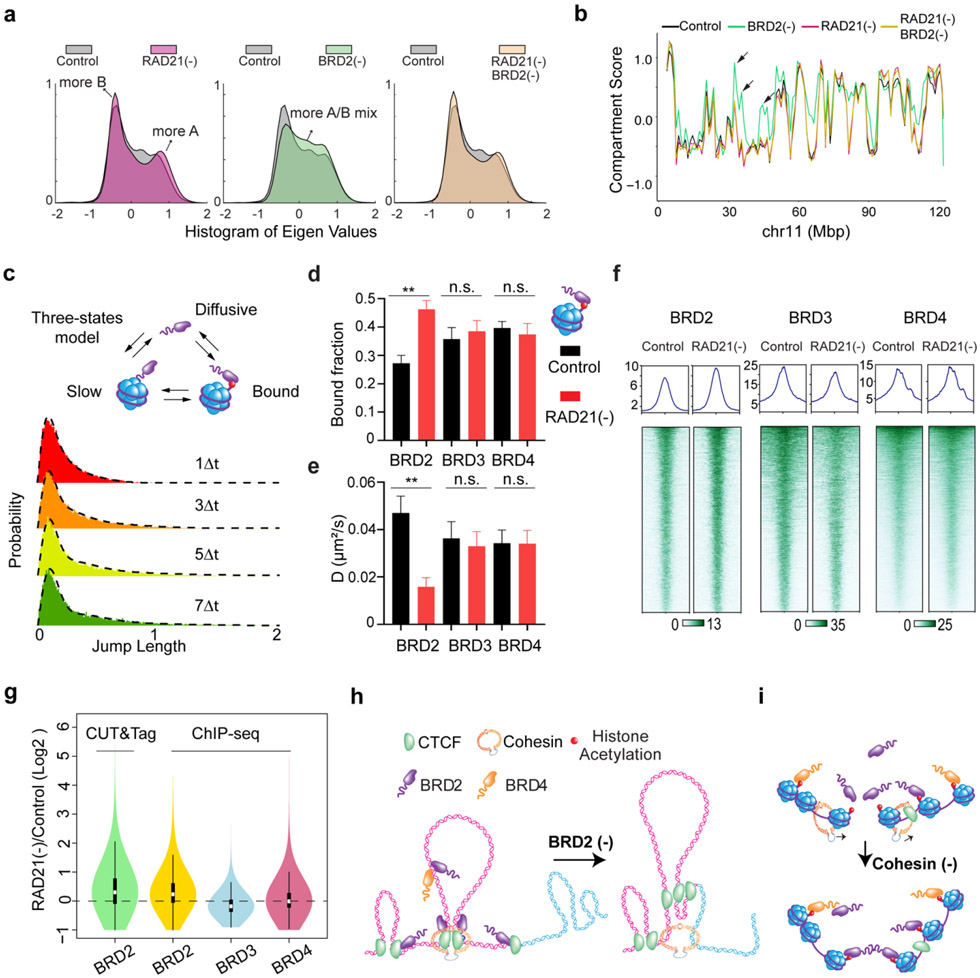
Fig.3 ∣. BRD2 interplays with Cohesin to safeguard active compartments.
(a) Histogram of eigenvector values from the Pearson’s correlation matrix of single BRD2 or RAD21 depletion and dual RAD21/BRD2 depletion for 6 hours compared to untreated Control from Micro-C experiments. BRD2 depletion increases the switching of B to A compartments.
(b) Browser track view of the eigenvector values for compartmental scores in various perturbation conditions in chromosomes 11 (Chr11). The genomic regions containing B to A switches after BRD2 depletion (green line) are highlighted with black arrows.
(c) Live cell single molecule tracking (SMT) of BET proteins by stroboscopic imaging. The jump length fitting of BRD2 dynamics is best described by a three-state model: diffusive, slow (likely transient, non-specific collision) and bound (likely stably bound to cognate sites). The probability distribution function of jump length or single molecule displacement was fit over multiple camera integration time scales. The same three-state model applies to BRD3 or BRD4 (data not shown).
(d-e) The chromatin bound fraction (d) and diffusion coefficient D (e) of BRD2, BRD3 and BRD4 before and after 6 hours of RAD21 depletion were quantified from SMT experiments. The number of cells analyzed are n=17 and n=19 for control and RAD21 depletion for BRD2 SMT, n=17 and n=17 for control and RAD21 depletion for BRD3 SMT, and n=17 and n=19 for control and RAD21 depletion for BRD4 SMT.
(f) ChIP-seq analysis of BRD2, BRD3 and BRD4 after 6 hours Cohesin depletion. Shown are the enrichment profile (upper panel) and heatmap (lower panel) of each protein over its binding peaks.
(g) A violin plot showing the log2 fold change of BRD2 CUT&Tag and BRD2/3/4 ChIP-seq intensity at corresponding peaks. Both BRD2 CUT&Tag and BRD2 ChIP-seq show preferential increase at BRD2 ChIP-seq peak regions compared to BRD3/BRD4.
(h) Putative model of B to A compartmental switch after removing BRD2. The active A compartment is colored in pink whereas the inactive B compartment in cyan. BRD2 molecules bind to the active A compartment enriched with CTCF and acetylated nucleosomes. BRD2 depletion weakens the boundary resulting in more Cohesin translocation into the neighboring inactive segments and more A/B mixing.
(i) Putative model showing the enhanced chromatin binding of BRD2 associated with an increased spatial clustering of ACDs upon Cohesin loss. For simplicity, two small segments containing acetylated nucleosomes are shown.
The non-parametric Mann-Whitney U test was used for statistical testing. **, p < 0.01; n.s., not significant.

