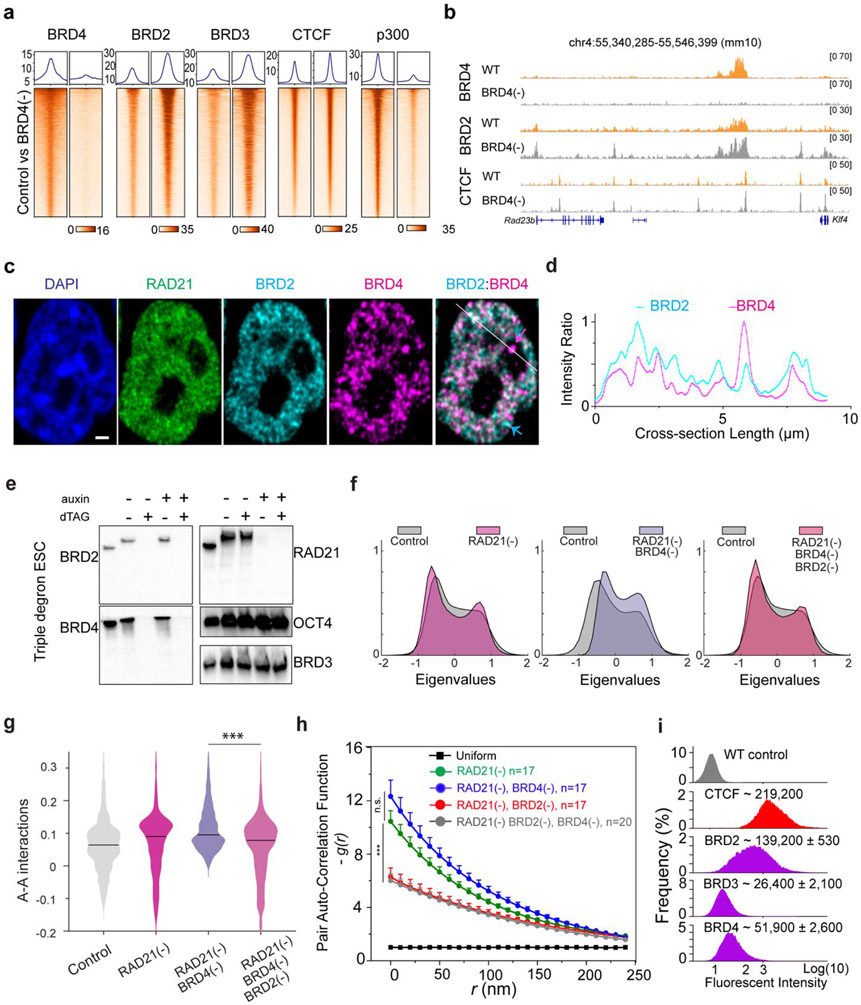
Fig.4 ∣. BRD4 antagonizes the role of BRD2 in genome organization.
(a) Enrichment profile and heatmap of BRD2/3/4, CTCF, P300 ChIP-seq signal at their respective binding peaks before and after BRD4 depletion.
(b) Representative genomic tracks (from integrated genomics viewer) of ChIP-seq signal of BRD2, BRD4 or CTCF after acute depletion of BRD4 for 6 hours.
(c) Representative single cell view of Cohesin (RAD21, green), BRD2 (cyan) and BRD4 (magenta) and merged BRD2/BRD4. The cyan arrow indicates the BRD2 puncta showing little colocalization with BRD4. The magenta arrow indicates the BRD4 puncta poorly colocalized with BRD2. The white line indicates the region to profile the fluorescent intensity. Scale bar, 1μm.
(d) Fluorescence intensity profile of BRD2(cyan) and BRD4 (magenta) along the while line in (c). The relative intensity ratio is plotted.
(e) WB analysis of the Rad21-AID : Brd4-dTAG : Brd2-dTAG triple edited ESC line. dTAG13 treatment (100nM, 6 hours) simultaneously depletes both BRD2 and BRD4 whereas auxin treatment (100μM, 6 hours) orthogonally depletes RAD21.
(f) Histogram of eigenvector values from the Pearson’s correlation matrix of single RAD21 depletion, dual RAD21/BRD4 or triple RAD21/BRD4/BRD2 depletion for 6 hours compared to untreated Control from Micro-C experiments.
(g) Quantification of the digitalized A-A compartmental interactions (log10 value of observed/expected) after single RAD21 depletion, dual RAD21/BRD4 depletion or triple RAD21/BRD2/BRD4 depletion for 6 hours from Micro-C experiments. Triple RAD21/BRD4/BRD2 depletion reduced the enhanced compartmentalization after the dual Cohesin/BRD4 depletion. The black solid line in each violin plot represents the median value.
(h) Degradation of BRD2 significantly reduced the accessible chromatin clustering after dual BRD4/RAD21 depletion. g(r) curves were plotted for indicated conditions. The non-parametric two-sided Mann-Whitney U test was used for statistical testing.
(i) Biallelic knock-in of HaloTag into endogenous BET family genes enable accurate quantification of individual BET family protein copy number by CTCF-calibrated flow cytometry in live cells. The mean and standard deviation of the quantified copy number from two biological experiments are shown above each plot.
The non-parametric Mann-Whitney U test was used for statistical testing. ***, p < 0.001; n.s., not significant.

