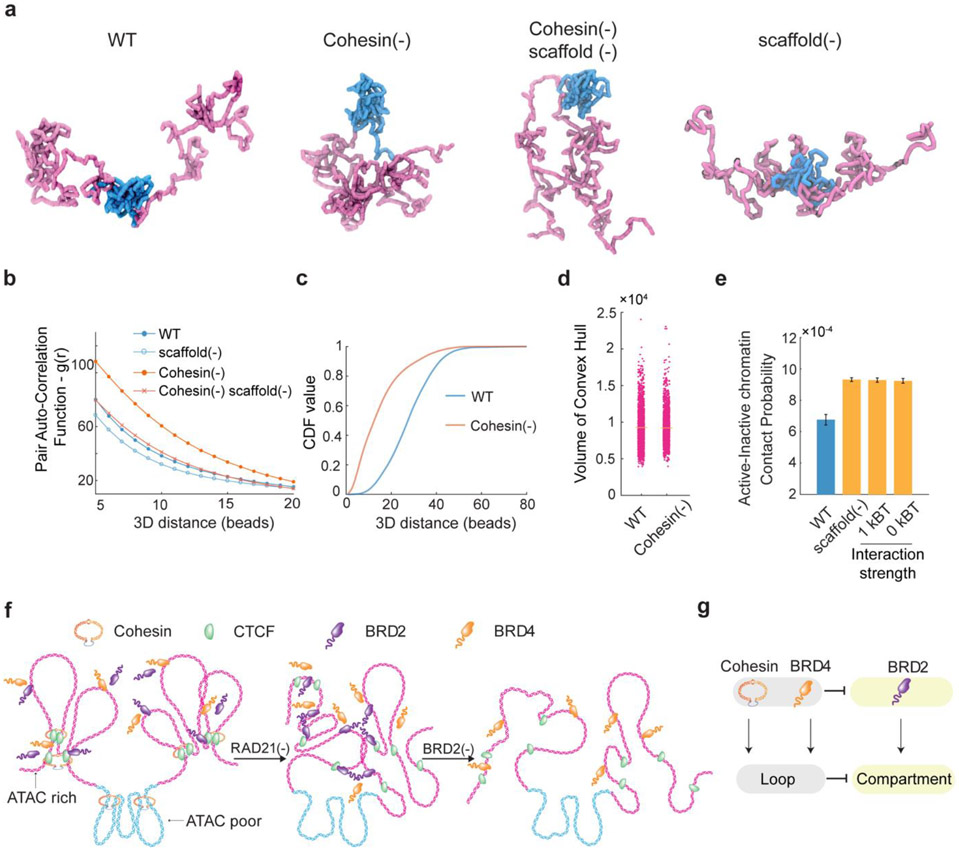
Fig.5 ∣. A revised polymer model recapitulates experimental observations.
(a) Representative chromatin conformation snapshots from polymer simulation incorporating both loop extrusion and scaffold protein-mediated interactions. Simulation snapshots represent wild type (WT, incorporating Cohesin, CTCF and scaffold protein), Cohesin depletion (−), scaffold depletion (−) and dual Cohesin and scaffold depletion. See details in the Polymer Modeling in the method section.
(b) Polymer simulation integrating both loop extrusion and scaffold protein-mediated dynamic protein-chromatin and protein-protein interactions reproduces enhanced clustering of ACDs upon Cohesin depletion. The pair auto-correlation function g(r) for active chromatin beads from all recorded polymer conformations were plotted for WT and Cohesin depletion in which the scaffold protein is present or depleted (−). Removing the scaffold protein decreases the g(r) as observed in Fig.2c and Extended Data Fig.4d.
(c) The cumulative distribution function (CDF) value as a function of the 3D loci pair distance from the center of neighboring ATAC-rich segments were extracted in WT (blue curve) and Cohesin depletion (−) plus scaffold protein conditions in which both loop extrusion and scaffold protein dynamic interaction are incorporated in the revised polymer model.
(d) Polymer model predictions of the segment volume of ATAC-rich segments under WT and Cohesin depletion (−) plus scaffold protein conditions. The new polymer model recapitulates experimental observations of the volume changes in Extended Data Fig.3a-b.
(e) Average contact probability between ATAC-rich regions and ATAC-poor regions for WT, scaffold protein depletion, WT with protein-protein interaction reduced from 2.5kBT to 1.0kBT (non-specific) and WT with protein-protein interaction depleted (0kBT) calculated from simulations. Error bar indicates the range of average contact probability from two ATAC-rich regions from both sides with the ATAC-poor regions in the middle. kB, Boltzmann constant; T, temperature.
(f) Schematic of putative chromatin configurational changes under WT (left), Cohesin depletion (middle) or dual Cohesin/BRD2 depletion (right) conditions. ATAC-rich and ATAC-poor segments are shown in pink and cyan color, respectively. Although Cohesin loss eliminates Cohesin-dependent loops, BRD2 (and others) orchestrates extensive protein-protein and protein-chromatin interactions that lead to the enhanced chromatin interactions between ATAC-rich segments and largely unchanged 3D volume of individual ATAC-rich segments. Further BRD2 depletion mitigates interactions between active chromatin segments and decompacts individual ATAC-rich segments.
(g) Summary model. Cohesin is the master regulator of chromatin loops. BRD4 could associate with NIPBL to enhance chromatin loop formation 70. Both BRD4 and Cohesin could suppress BRD2 binding to chromatin, which in turn antagonize chromatin compartmentalization in euchromatin.

