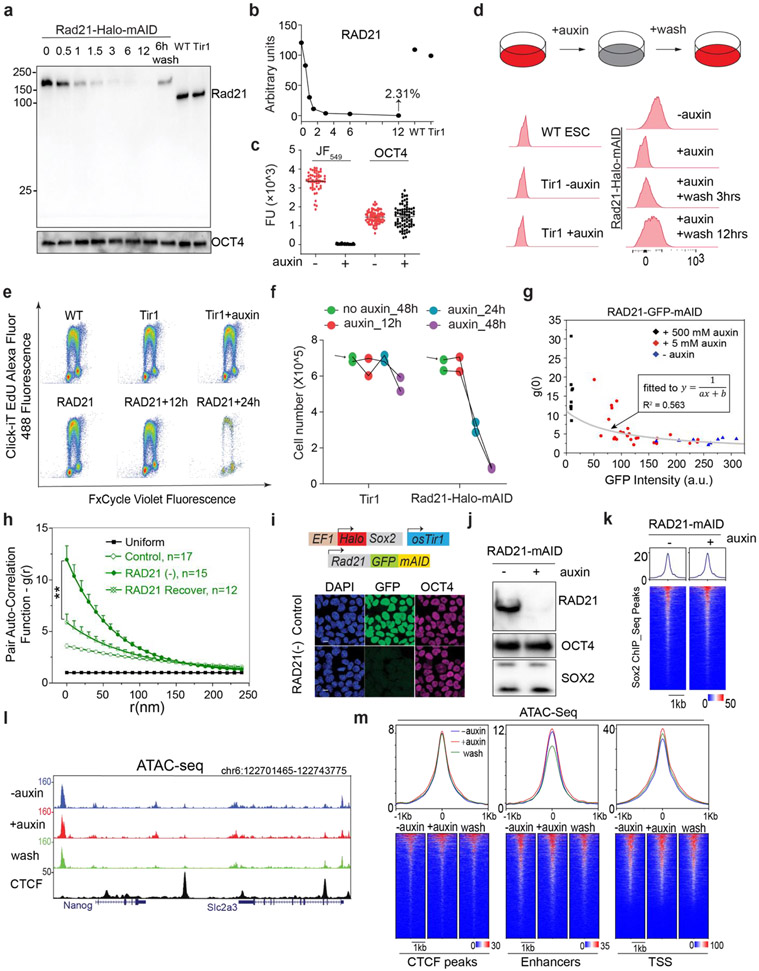
Extended Data Fig.1 ∣. Efficient AID degron-mediated RAD21 depletion. Related to Fig.1.
(a) Western blot (WB) analysis of protein levels of endogenous RAD21-HaloTag-mAID at indicated time points after the auxin treatment and wash off recovery. OCT4 protein was used as the internal control.
(b) The WB intensity is represented as grey scale values for the corresponding WB bands in (a).
(c) Single cell fluorescence intensity analysis of HaloTag-mAID-RAD21 and OCT4 protein levels after auxin treatment shown in Fig.1a. RAD21 was stained with the HaloTag ligand JF549. OCT4 was detected by immunofluorescence. FU, arbitrary fluorescent unit. The black line represents mean fluorescence value.
(d) Flow cytometry analysis of RAD21 levels before (−auxin), after (+auxin) auxin treatment and during the recovery after auxin wash off. Cells were stained with 100nM HaloTag ligand JF549. The parent Tir1 ES cells (Tir1 − auxin; Tir1 + auxin) were used as the negative control (adopted from Extended data Fig.4d from our previous work 24). 50,000 gated live cells were recorded and analyzed for each condition.
(e) DNA synthesis analysis of RAD21-HaloTag-mAID ESCs by the Click-iT EdU labeling kit at the indicated time points after auxin treatment. The same number (50,000) of cells were analyzed for all conditions.
(f) Cell proliferation analysis of parental Tir1 (left) and RAD21-Halo-mAID (right) ESCs after auxin treatment. Cells were treated with auxin for indicated time points and the total cell number was measured after 48 hours. Data from two replicates were shown.
(g) The dose-dependent effect of Cohesin depletion on global accessible chromatin clustering revealed by the inverse relationship between clustering amplitude (A) and residual RAD21 levels measured by RAD21-GFP-mAID fluorescence intensities (arbitrary fluorescent units). Specifically, two different auxin concentrations (5 μM and 500 μM) were used to generate a gradient of RAD21 level in single cells.
(h) Pair auto-correlation function g(r) of ATAC-PALM localizations from RAD21-GFP-mAID ESCs under normal, auxin-treated and recovery conditions after auxin wash off (~24 hours). The error bars represent standard error (SE). The Mann-Whitney U test was performed. ** indicates p<0.01.
(i) HaloTag-SOX2 fusion protein is stably expressed in the RAD21-mAID-GFP cells co-expressing the E3 ligase osTir1. Single cell fluorescence analysis of Cohesin levels upon acute auxin treatment.
(j) WB analysis of RAD21, OCT4 or SOX2 upon auxin addition. SOX2 antibody detects both endogenous (lower band) and ectopic expressed HaloTag-SOX2 proteins (upper band).
(k) Chromatin accessibility at SOX2 binding sites is not significantly affected by RAD21 depletion. The ATAC-seq enrichments around [−1kb 1kb] region centering SOX2 binding sites are color encoded and ranked by SOX2 ChIP-seq peak intensity.
(l) ATAC-seq enrichment at a representative genomic region under normal (−auxin), auxin-treated (+auxin) and recovery conditions for RAD21-HaloTag-mAID cells. CTCF ChIP-seq track is displayed below as a reference.
(m) RAD21-HaloTag-mAID cells were processed for genome-wide ATAC-seq analysis under conditions including without auxin, auxin treatment and washout after auxin treatment. RAD21 depletion does not noticeably change the chromatin accessibility at enhancers, promoters and insulator region.

