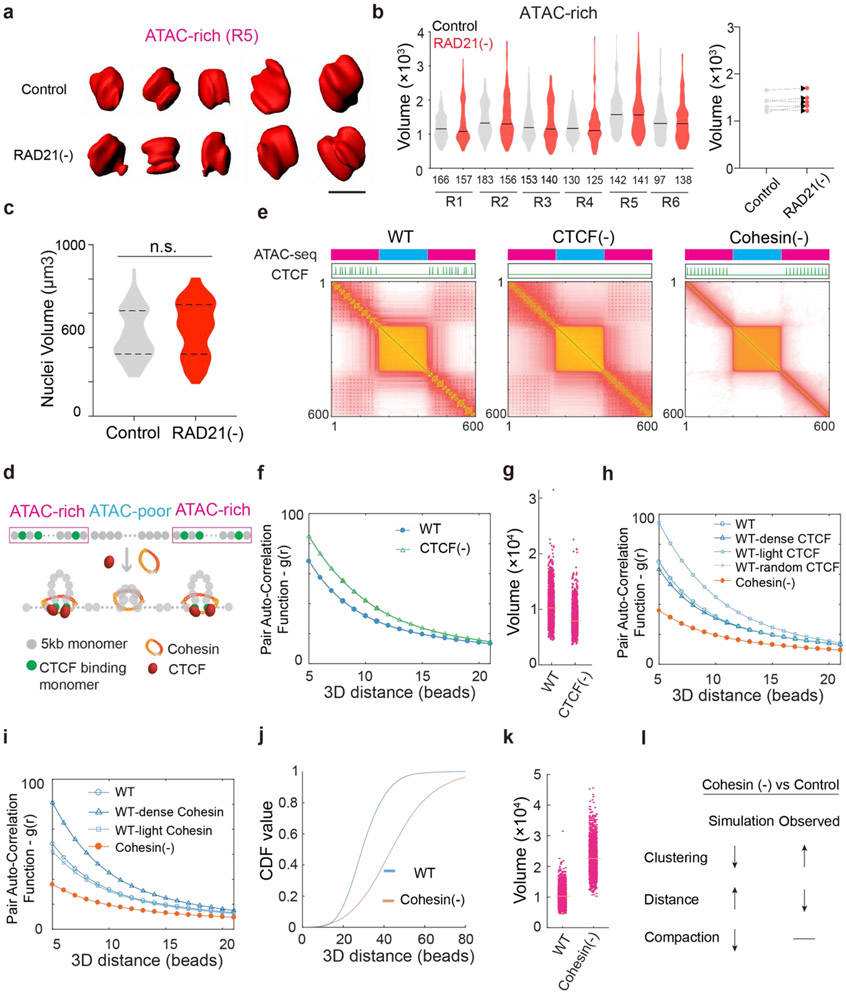
Extended Data Fig.3 ∣. Polymer model simulation based on loop extrusion only. Related to Fig.1.
(a) Representative iso-surfaces of an ATAC-rich segment (R5, red) in Control and RAD21 depletion conditions. Scale bar, 1 μm.
(b) (Left)Violin plot of 3D volumes (the number of voxels) of six ATAC-rich segments (R1-R6) before and after RAD21 depletion. The number of alleles analyzed is indicated at the bottom. The black bar indicates the median value for each data set. The Mann-Whitney U test was applied, and we do not find statistical difference for the 3D volume distribution before and after RAD21 depletion. (Right)The paired mean value of 3D volume (number of voxels) for the 6 ATAC-rich regions before and after RAD21 depletion is plotted.
(c) Quantification of nuclei volume as determined by DAPI signal before (n=65) and after (n=69) RAD21 depletion for 6 hours. Dashed lines indicate the first and third quartiles. No statistical significance was found (n.s., not significant with p value 0.21) by the non-parametric Mann-Whitney test.
(d) The schematic overview of the polymer simulation. The chromatin polymer is modeled as beads on a string. We simulated two ATAC-rich segments (pink) on both ends and one ATAC-poor segments (blue) in the middle. Each segment is simulated with 200 monomers (grey) each representing a 5kb genomic segment. In each ATAC-rich segment, every 15th bead was assigned as CTCF binding sites (CTCF monomer, green) to insulate the loop extrusion by Cohesin. See details of simulation parameter set up in the Methods.
(e) Contact probability map for the wild type (WT), CTCF depletion and Cohesin depletion conditions by considering loop extrusion mechanism alone. Two panels shown on the top are distinct ATAC segments and the relative positions of CTCF binding beads in the polymer model.
(f-g) Distributions for the volume of the convex hull (f) or the pair auto-correlation function g(r) (g) of the ATAC-rich segments after CTCF depletion base on the ‘loop-extrusion only’ simulation model.
(h-i) Simulation results are robust with respect to the setup of the model. (h) g(r) for varying the location and density of CTCF-binding sites for the wild type (blue) compared to the Cohesin depletion (orange). Dense, normal, light CTCF densities correspond to 36, 24 and 12 CTCF sites on the chromatin, respectively. Random CTCF sites correspond to randomly generate 24 CTCF sites on the chromatin. (i) Pair auto-correlation function g(r) for varying the number of Cohesin molecules on the chromatin for the WT ( blue) compared to the Cohesin depletion (orange). Dense, normal, light Cohesin densities correspond to the extrusion separation of 45kb, 90kb and 180kb, respectively.
(j-k) The 3D loci pair distance from neighboring ATAC-rich segments (j) and distributions for the volume of the convex hull of ATAC-rich segments (k) were extracted in WT and Cohesin depleted conditions in which the ‘loop-extrusion only’ simulation model is considered. The average volume (yellow bar) for ATAC-rich segments of the Cohesin depletion is larger than that of the WT condition.
(l) Summary of accessible chromatin clustering, neighboring distance, and compaction based on ‘loop-extrusion only’ polymer model simulation compared with experimental observations.

