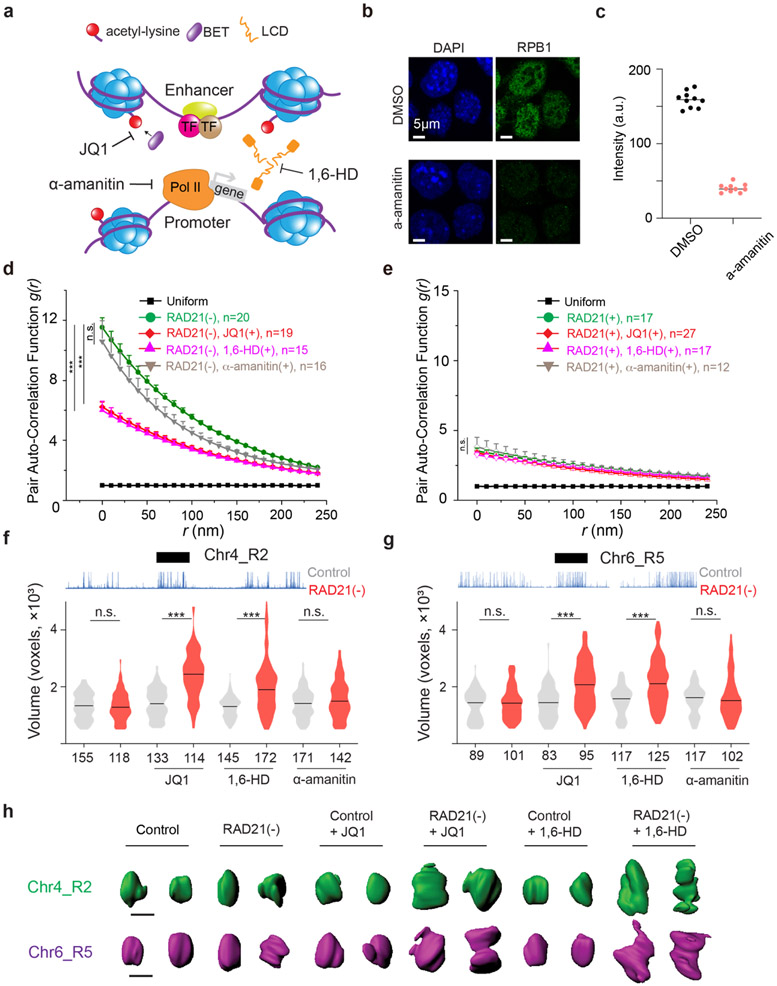
Extended Data Fig.4 ∣. Regulation of accessible chromatin domains involves BET family proteins. Related to Fig.2.
(a) A schematic of multiple small molecule inhibitors to target highly enriched nuclear proteins in the enhancer and promoter regions within ACDs. Alpha-amanitin inhibits the RNA Polymerase II by selectively targeting its largest subunit Rpb1 for degradation. JQ1 specifically blocks BET proteins from binding to acetyl-lysine residuals on target proteins (e.g., nucleosomes). 1,6-hexanediol (1,6-HD) targets the protein-protein interactions (e.g., the Mediator complex) often mediated by low complexity domains (LCDs).
(b-c) Immunofluorescence analysis of Rbp1 before and after 5 hours of alpha-amanitin treatment. (b) Cells were treated with alpha-amanitin at a final concentration of 100 μg/ml for 5 hours and then fixed for immunofluorescence analysis by using purified anti-RNA Polymerase II RPB1 antibody (H14, BioLegend) with a dilution of 1:500. Scale bar, 5μm. The experiments have been independently repeated for three times. (c) Quantification of fluorescence intensity values over 10 individual cells for each condition.
(d) Disrupting BET-chromatin interactions or LCD mediated protein-protein interactions by JQ1 or 1,6HD, respectively, reduces accessible chromatin clustering measured by 3D ATAC-PALM after Cohesin depletion whereas alpha-amanitin treatment had no significant effect. g(r) curves were plotted for indicated conditions. The non-parametric two-sided Mann-Whitney U test was used for statistical testing.
(e) Treatment of JQ1, 1,6HD or alpha-amanitin does not reduces accessible chromatin clustering in the presence of Cohesin. g(r) curves were plotted for indicated conditions. The two-sided Mann-Whitney U test was used for statistical testing.
(f-g) Violin plot of 3D volumes (the number of voxels) of two ATAC-rich segments R2 (f) and R5 (g) before (grey) and after (red) auxin-mediated RAD21 depletion with or without JQ1(1μM, 12 hours), 1,6-HD (2%, ,1.5 hours) or alpha-amanitin (100μg/mL, 5 hours) treatment. The number of alleles analyzed is indicated at the bottom. The black bar indicates the median value for each data set and Mann-Whitney U test was applied for statistical test. ***, p < 0.001; n.s., not significant.
(h) Representative iso-surfaces of an ATAC-rich segments R2 (green) and R5 (magenta) in control, JQ1 (1μM, 12 hours), and 1,6-HD (2%, ,1.5 hours) treated cells before and after auxin-mediated RAD21 depletion. Scale bar, 1 μm.

