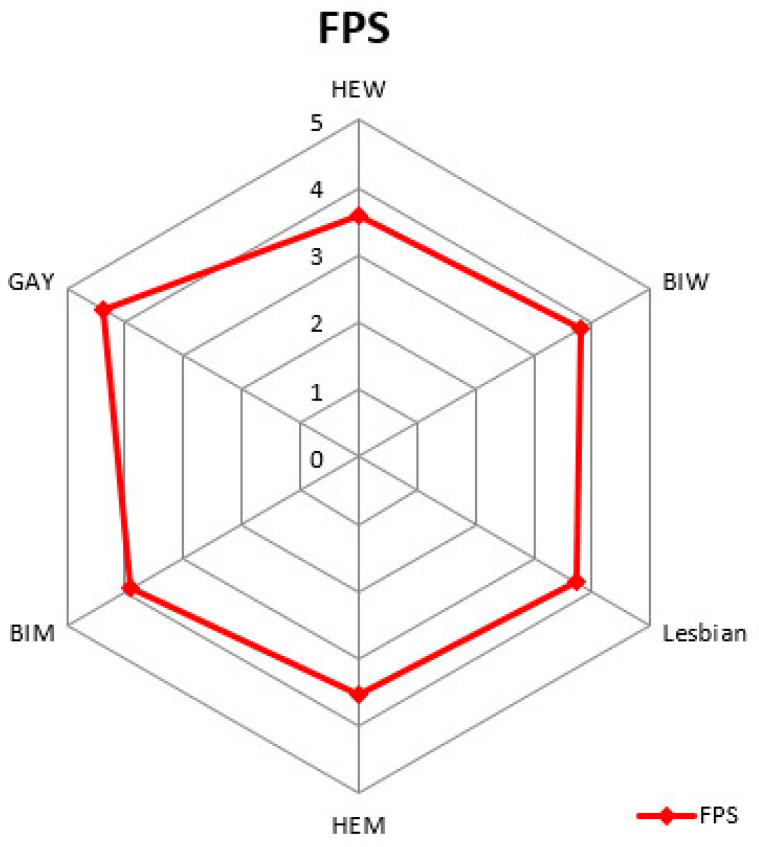
Figure 1.
The figure shows the FPS results divided by sexual orientations. It is possible to appreciate how differently the results are distributed in the sexual minority groups of both genders compared to heterosexual peers. Gay men showed the highest scores for fat phobia in all groups included in the study, see Table 2 for data.

