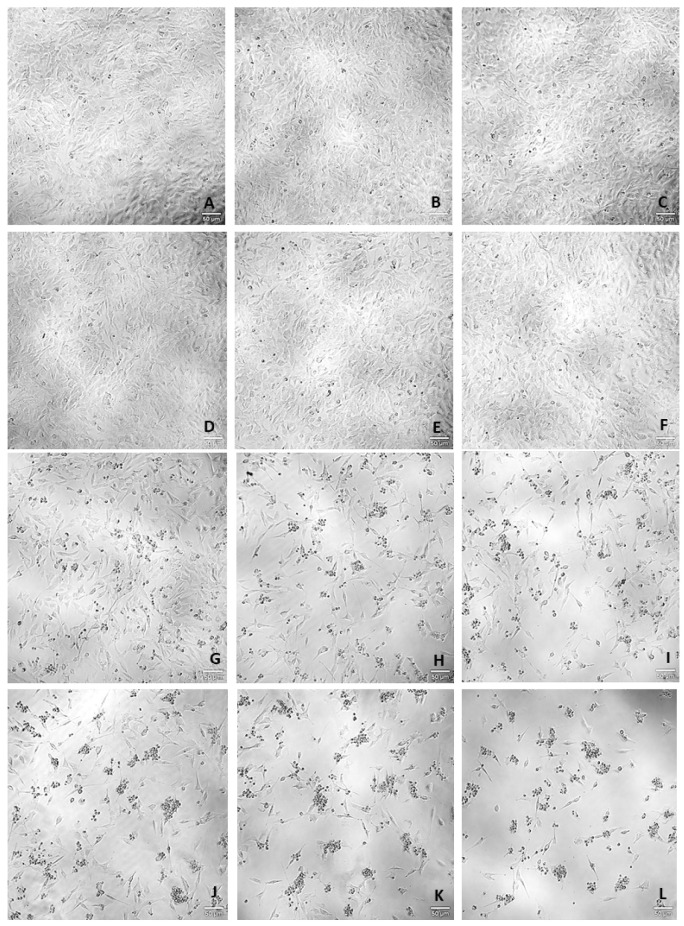
Figure 2.
Representative images (100× total magnification) of SH-SY5Y cell morphologies after exposures to varied concentrations of hydrocortisone and H2O2. Cells were incubated with (A) vehicle (0.1% DMSO) (B) hydrocortisone 100 µM, (C) hydrocortisone 200 µM, (D) hydrocortisone 300 µM, (E) hydrocortisone 400 µM, (F) hydrocortisone 500 µM, (G) H2O2 50 µM, (H) H2O2 100 µM, (I) H2O2 150 µM, (J) H2O2 200 µM, (K) H2O2 250 µM, and (L) H2O2 300 µM. scale bar = 50 μm.

