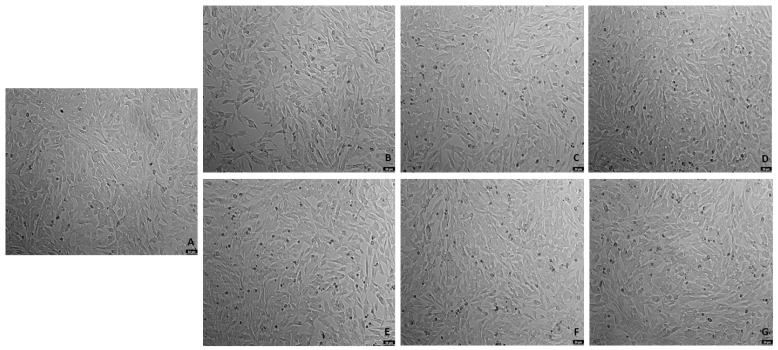
Figure 6.
Representative images (100× total magnification) of SH-SY5Y cell morphologies after exposures to varied concentrations of the combination of mirtazapine with H2O2. Cells were incubated with (A) vehicle (0.1% DMSO) (B) H2O2 132 µM, (C) H2O2 132 µM + mirtazapine 0.01 µM, (D) H2O2 132 µM + mirtazapine 0.1 µM, (E) H2O2 132 µM + mirtazapine 1 µM (F) H2O2 132 µM + mirtazapine 10 µM, and (G) H2O2 132 µM+ mirtazapine 20 µM. scale bar = 50 μm.

