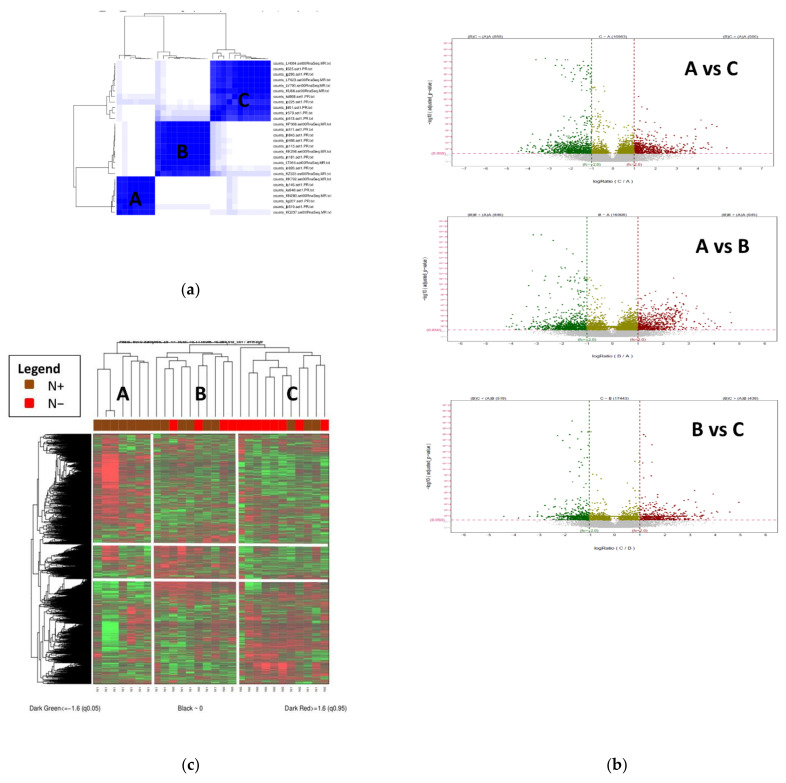
Figure 2.
(a). Unsupervised analysis of our population highlights 3 groups A (N = 7), B (N (N = 10) and C (N = 11) (b). Heatmap of differentially expressed genes between the 3 identified clusters (A, B and C) (c). Volcano plots of up-regulated (red) and down-regulated (green) differentially expressed genes between the three clusters, Institut Bergonie, 2010–2017.

