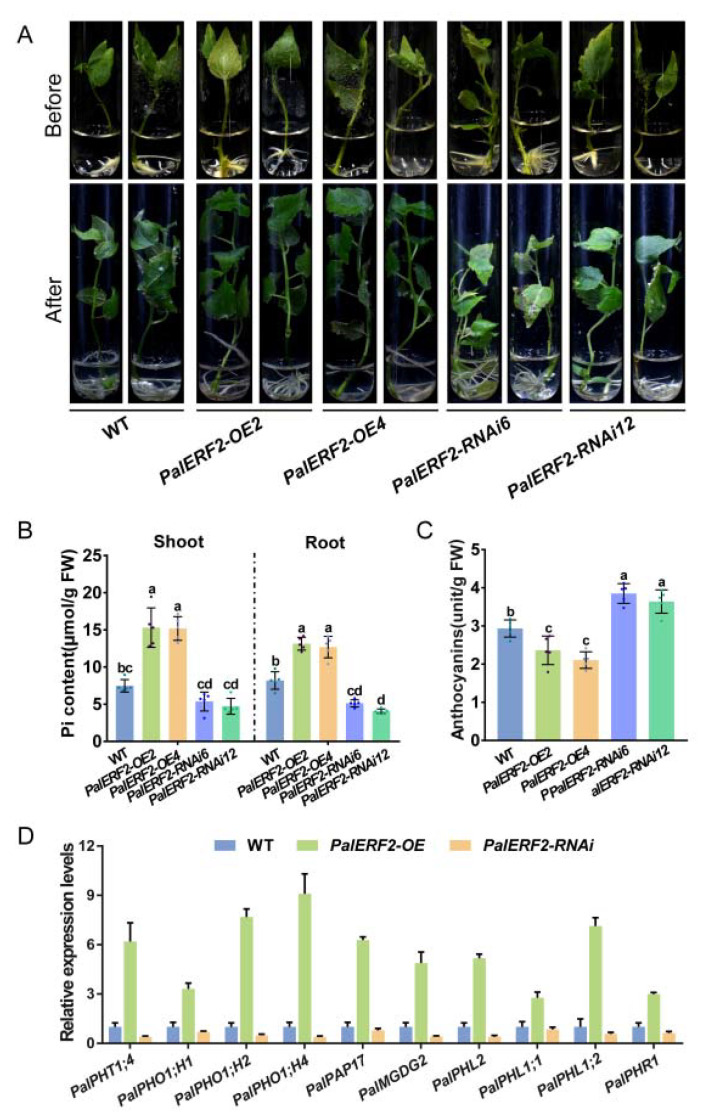
Figure 2.
The PalERF2 transgenic poplars under low Pi condition. (A) Phenotypes of transgenic and WT poplars grew in liquid medium with 10 μM Pi for 4 weeks. (B) The Pi contents of transgenic and WT poplars in root and shoot after low Pi treatment. (C) Anthocyanin contents of WT and transgenic poplar after low Pi treatment. Error bars indicate SD values from five biological replicates. Significant differences were analyzed by Duncan’s test (p < 0.05, n = 5). Different letters indicate statistically significant differences. (D) The qRT-PCR analysis of Pi starvation response (PSR) genes in PalERF2-OE, PalERF2-RNAi, and WT poplars. Error bars indicate SD values from three biological replicates.

