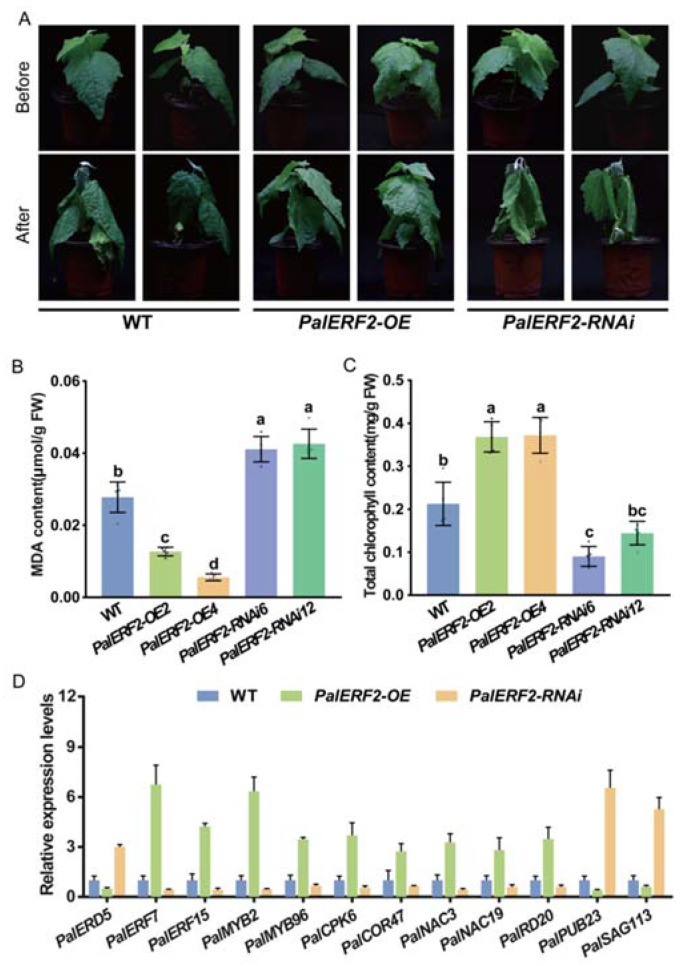
Figure 4.
The phenotypes of PalERF2 transgenic poplars under drought stress. (A) The phenotypes of transgenic and WT poplars after 5 days of drought treatment. (B) The MDA contents were measured after drought treatment. (C) The total chlorophyll contents were measured after drought treatment. (B,C) values represents means ± SD (n = 5). Significance of differences was analyzed by Duncan’s test (p < 0.05, n = 5). Different letters indicate statistically significant difference. (D) The relative expression of drought-associated genes in PalERF2-OE, PalERF2-RNAi, and WT poplars. Error bars indicate SD values from three biological replicates.

