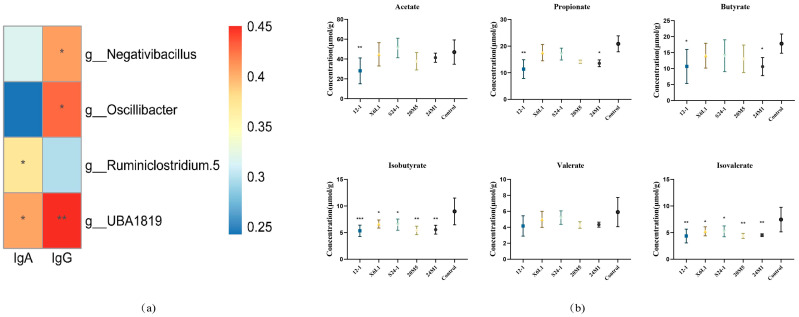
Figure 7.
Analysis of L. fermentum on gut microbiota in mice and cecum SCFAs. (a) The correlation between IgA, IgG and colonic microbiota. “*” indicates p < 0.05, and “**” indicates p < 0.01 (compared with control group); (b) The content of short chain fatty acids in cecum. “*” indicates p < 0.05, and “**” indicates p < 0.01, “***” indicates p < 0.001 (compared with control group).

