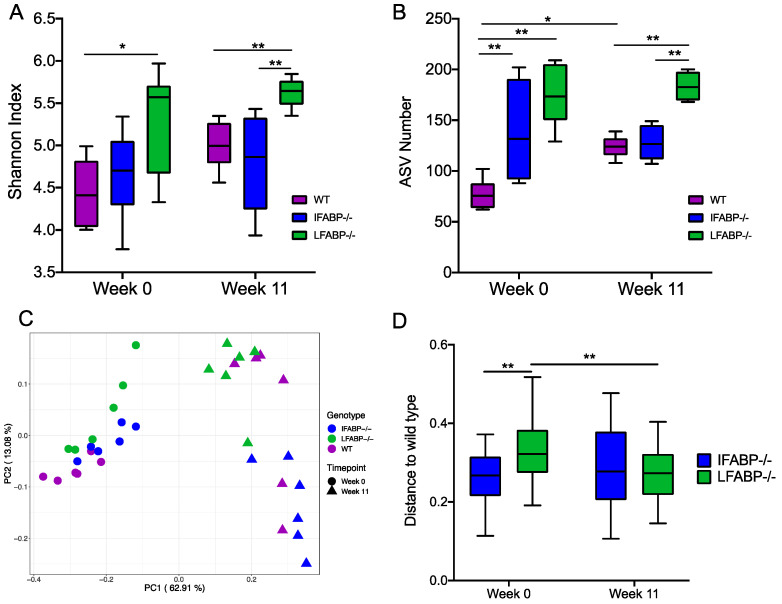
Figure 2.
Effect of IFABP and LFABP knockout and a HF diet on the gut microbiota. (A) Shannon Index; (B) ASV number; (C) Principal coordinate plot based on weighted UniFrac distance; (D) Weighted UniFrac distance from IFABP−/− and LFABP−/− to WT at each time point. Data at different timepoints within the same genotype group were compared using the Wilcoxon matched-pairs signed-ranks test (two-tailed) and data at the same timepoint between the groups were compared using the Mann–Whitney test (two-tailed). * p < 0.05, ** p < 0.01. Boxes show the medians and the interquartile ranges (IQRs), and the whiskers denote the lowest and highest values within 1.5 times the IQR from the 1st and 3rd quartiles. N = 6 for each group.

