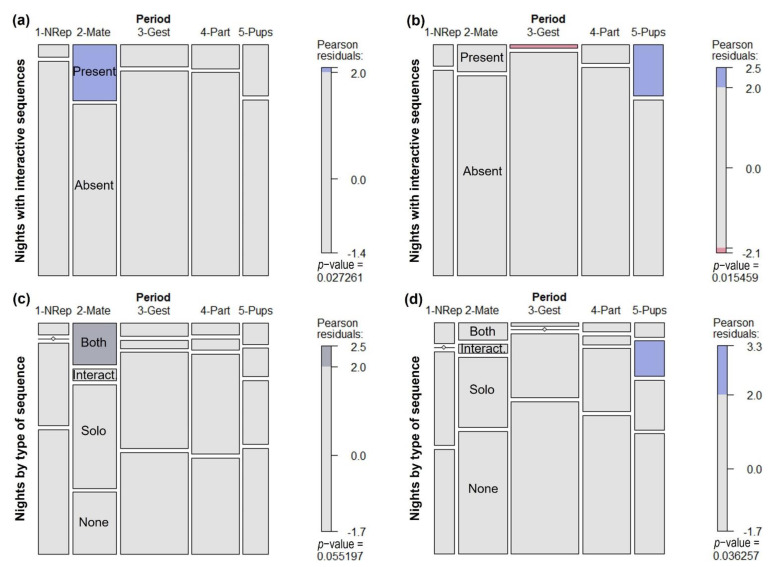
Figure 6.
Mosaic plots showing the proportion of nights in each roar-bark activity category through time. Each mosaic tile area is proportional to the observed number of nights in each category (height) and the number of nights sampled in each time period (width). Time periods are as follows: NRep = non-reproductive; Mate = mating; Gest = gestation; Part = parturition; and Pups = initial parental care. Pearson residuals were used in a Chi-Square Test of Independence to verify if there is a difference among observed and expected values. Blue tiles have significantly greater frequency values than expected, dark grey tiles have greater frequency values than expected, but marginally significant, and red tiles have significantly smaller frequency values than expected. All other tiles show no significant difference among observed and expected values. (a) Proportions of nights with and without interactive roar-bark sequences using the entire dataset; (b) Proportions of nights with and without interactive roar-bark sequences using the subsampled dataset considering only the 5 recorders common to all periods; (c) Proportion of each category of vocal activity using the entire dataset; (d) Proportions of each vocal activity category using the subsampled dataset considering only the 5 recorders common to all periods. Categories of vocal activity are as follows: None = no vocal activity; Solo = only solo roar-bark sequences; Interact. = only interactive roar-bark sequences; and Both = solo and interactive sequences. Plots made in R with function mosaic {vcd}.

