Figure 1.
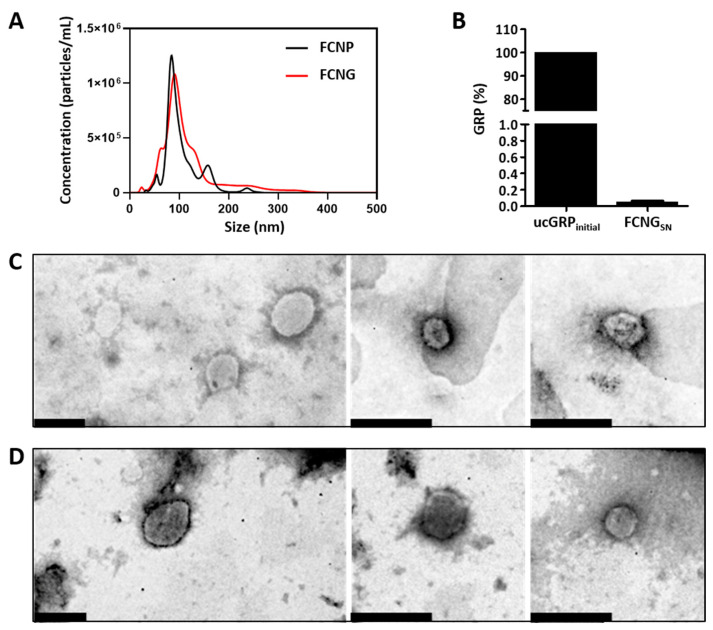
FCNP and FCNG size distribution, ucGRP incorporation and morphology. (A) Representative analysis of FCNP and FCNG by nanotracking analysis (NTA), showing the concentration of particles as a function of size. (B) Percentage of ucGRP initially used for FCNG synthesis (ucGRPinitial), and in the supernatants after separation of pelleted nanoparticles (FCNGSN), representing non-incorporated ucGRP, determined by ELISA. Data are representative of six independent experiments. (C,D) Ultrastructural characterization of FCNP (C) and FCNG (D) by transmission electron microscopy (TEM). Scale bar of 200 nm.

