Figure 4.
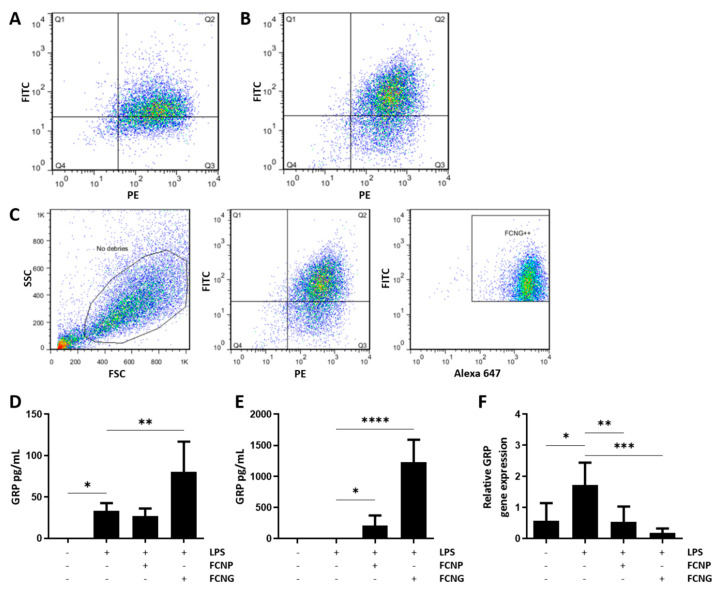
Binding/uptake of FCNP and FCNG by THP1-MoM cells. (A–C) Flow cytometry analysis of FCNP and FCNG in THP1-MoM cells. (A,B) Dot plots of THP-1 MoM cells exposed to (11.7 ± 4.5) × 109 particles/mL of FCNP (A) and FCNG (B) for 2 h. The Q2 quadrant represents cells that have, simultaneously, fluorescein-labeled nanoparticles and the THP-1 MoM marker labeled with PE (double positive for FITC and PE). Q2 is 67.1% for FCNP (A) and 73.7% for FCNG (B). (C) Gating strategy used for the analysis of FCNG in THP1-MoM cells. The first plot shows the debris exclusion in the side scatter (SSC) vs. the forward scatter (FSC). In the second plot, the double positive population for fluorescein-labeled nanoparticles and the THP-1 MoM marker was gated (73.7% are double positive for FITC and PE). Finally, the last plot shows the selection of the population of interest, FCNG++, which represents THP-1 MoM cells with fluorescein-labeled nanoparticles containing GRP labeled with Alexa 647 (73.3% are triple positive for FITC, PE and Alexa 647). (D,E) Quantification of GRP present in THP1-MoM cell protein extracts (D) and in the cell culture media (E) by ELISA, after pre-treatments with (11.7 ± 4.5) × 109 particles/mL of FCNP and FCNG for 24 h, followed by stimulation with LPS (100 ng/mL) for an additional 24 h. Non-stimulated cells were used as controls for LPS stimulation. (F) Relative GRP gene expression determined by quantitative polymerase chain reaction (qPCR) of experiments described in (D,E). Data in (D–F) are representative of three independent experiments and presented as mean ± SD. Two-way ANOVA and multiple comparisons were achieved with the Dunnett’s test, and presented relative to the LPS-stimulated cells. Statistical significance was defined as p ≤ 0.05 (*), p ≤ 0.01 (**), p ≤ 0.001 (***) and p ≤ 0.0001 (****).

