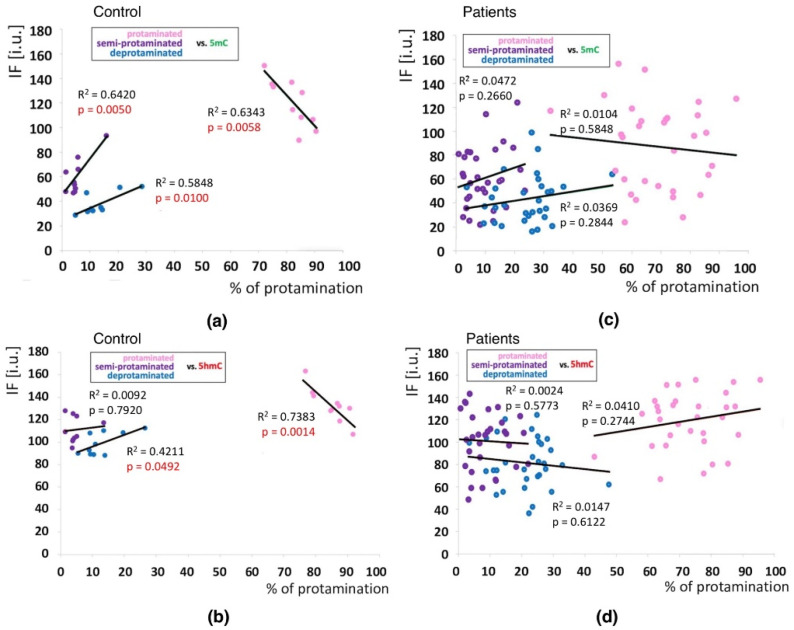
Figure 5.
Correlations between methylation (5mC) and hydroxymethylation (5hmC) values (IF) vs. chromatin protamination status shown in three sperm subpopulations in the control and patient groups. (a): 5mC vs. protamination in the control group; (b): 5hmC vs. protamination in the control group; (c): 5mC vs. protamination in the patient group; (d): 5hmC vs. protamination in the patient group. Each point in the graph represents one case. For each male at least 50 spermatozoa per subpopulation were analysed. Subpopulations of spermatozoa are coded with following colour: pink for properly protaminated, purple for semi-protaminated, and blue for deprotaminated. Statistical significance was considered at p < 0.05.

