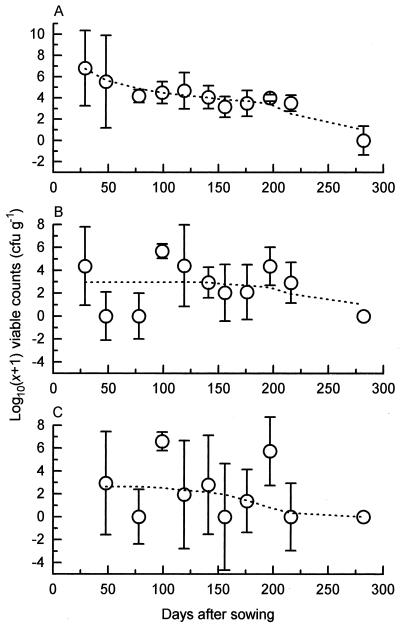
FIG. 2.
Temporal variation during 1996 to 1997 of viable counts of P. fluorescens SBW25 established in the phytosphere microflora of sugar beet rhizosphere (A), leaf (B), and leaf bud (C) samples. Group medians for each sampling occasion are plotted (circles), along with their respective boxplot notches (bars [27]), enabling a pairwise comparison of group medians at the 95% level; overlapping bars indicate medians that are not significantly different. Dotted lines represent the same data after smoothing with the 4253H twice algorithm (27).

